| Full name: synaptonemal complex central element protein 2 | Alias Symbol: CESC1 | ||
| Type: protein-coding gene | Cytoband: 19p13.13 | ||
| Entrez ID: 256126 | HGNC ID: HGNC:27411 | Ensembl Gene: ENSG00000161860 | OMIM ID: 611487 |
Expression of SYCE2:
| Dataset | Gene | EntrezID | Probe | Log2FC | Adj.pValue | Expression |
|---|---|---|---|---|---|---|
| GSE17351 | SYCE2 | 256126 | 237304_at | -0.0572 | 0.9183 | |
| GSE26886 | SYCE2 | 256126 | 237304_at | 0.2246 | 0.2317 | |
| GSE45670 | SYCE2 | 256126 | 237304_at | 0.0769 | 0.4984 | |
| GSE53622 | SYCE2 | 256126 | 93572 | 0.3922 | 0.0003 | |
| GSE53624 | SYCE2 | 256126 | 93572 | 0.9620 | 0.0000 | |
| GSE63941 | SYCE2 | 256126 | 237304_at | 0.8632 | 0.0979 | |
| GSE77861 | SYCE2 | 256126 | 237304_at | 0.0337 | 0.8299 | |
| GSE97050 | SYCE2 | 256126 | A_32_P203528 | -0.1514 | 0.6268 | |
| SRP133303 | SYCE2 | 256126 | RNAseq | 0.4981 | 0.2624 | |
| SRP219564 | SYCE2 | 256126 | RNAseq | 0.5613 | 0.3049 | |
| TCGA | SYCE2 | 256126 | RNAseq | 1.0378 | 0.0091 |
Upregulated datasets: 1; Downregulated datasets: 0.
Survival by SYCE2 expression:
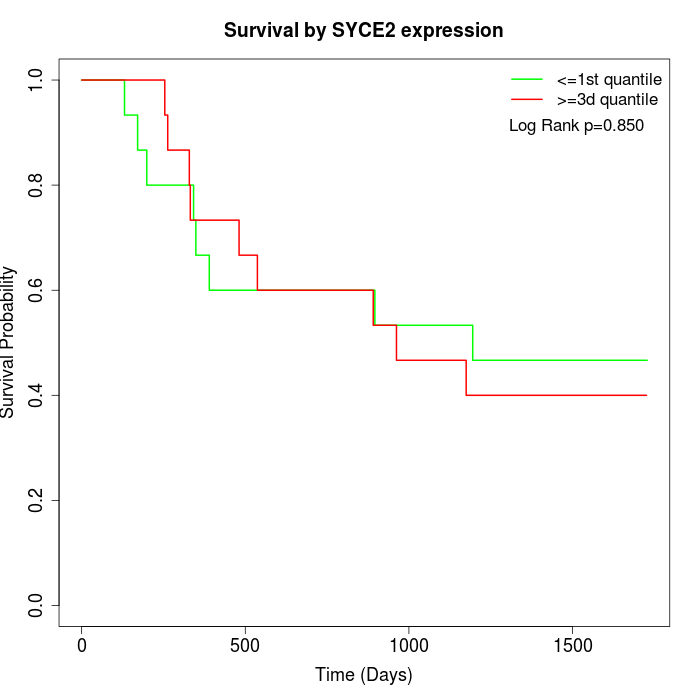 | 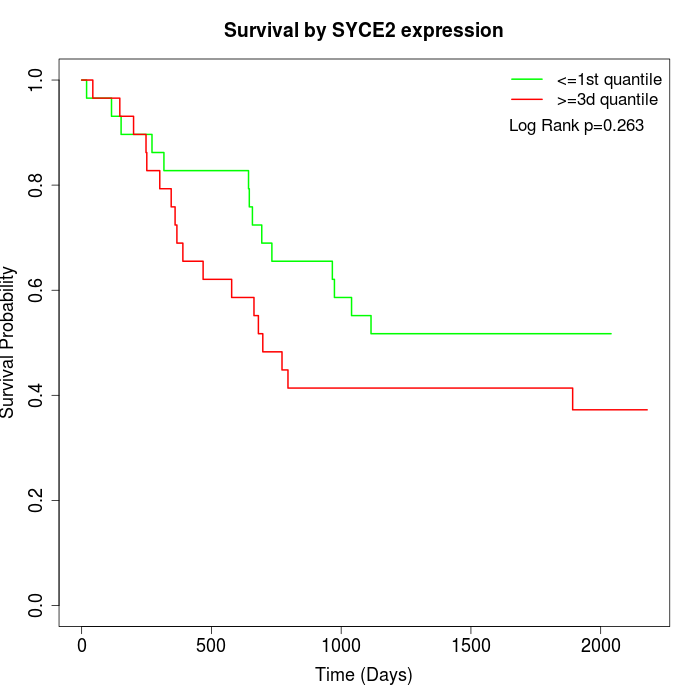 | 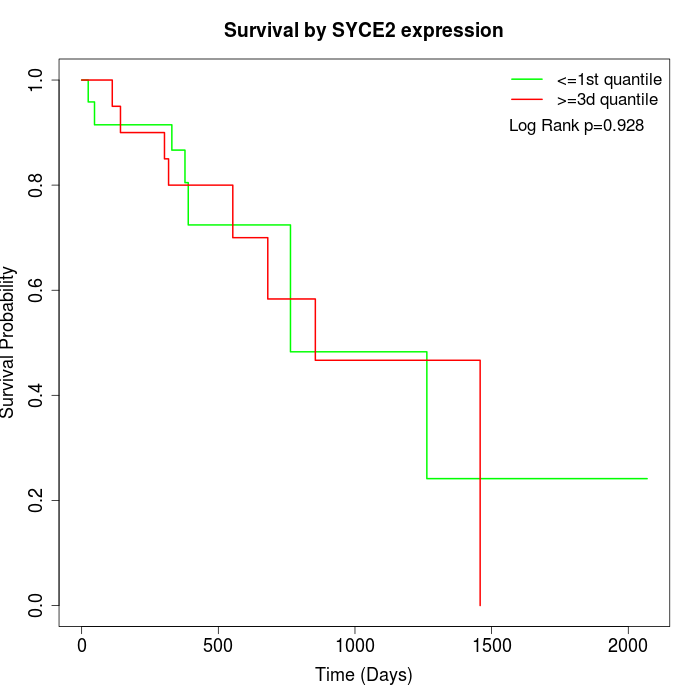 |
| GSE53622 | GSE53624 | TCGA |
Note: Click image to view full size file.
Copy number change of SYCE2:
| Dataset | Gene | EntrezID | Gain | Loss | Normal | Detail |
|---|---|---|---|---|---|---|
| GSE15526 | SYCE2 | 256126 | 4 | 2 | 24 | |
| GSE20123 | SYCE2 | 256126 | 3 | 1 | 26 | |
| GSE43470 | SYCE2 | 256126 | 2 | 6 | 35 | |
| GSE46452 | SYCE2 | 256126 | 47 | 1 | 11 | |
| GSE47630 | SYCE2 | 256126 | 4 | 7 | 29 | |
| GSE54993 | SYCE2 | 256126 | 16 | 3 | 51 | |
| GSE54994 | SYCE2 | 256126 | 8 | 13 | 32 | |
| GSE60625 | SYCE2 | 256126 | 9 | 0 | 2 | |
| GSE74703 | SYCE2 | 256126 | 2 | 4 | 30 | |
| GSE74704 | SYCE2 | 256126 | 0 | 1 | 19 | |
| TCGA | SYCE2 | 256126 | 17 | 12 | 67 |
Total number of gains: 112; Total number of losses: 50; Total Number of normals: 326.
Somatic mutations of SYCE2:
Generating mutation plots.
Highly correlated genes for SYCE2:
Showing all 15 correlated genes with mean PCC>0.5.
| Gene1 | Gene2 | Mean PCC | Num. Datasets | Num. PCC<0 | Num. PCC>0.5 |
|---|---|---|---|---|---|
| SYCE2 | GPM6A | 0.694738 | 3 | 0 | 3 |
| SYCE2 | KBTBD12 | 0.625168 | 4 | 0 | 3 |
| SYCE2 | SLITRK2 | 0.62285 | 3 | 0 | 3 |
| SYCE2 | TNNT3 | 0.621455 | 3 | 0 | 3 |
| SYCE2 | GPR22 | 0.621027 | 3 | 0 | 3 |
| SYCE2 | GRIK5 | 0.6034 | 4 | 0 | 3 |
| SYCE2 | ZNF428 | 0.588019 | 3 | 0 | 3 |
| SYCE2 | ACADS | 0.576166 | 4 | 0 | 3 |
| SYCE2 | WNT1 | 0.555524 | 3 | 0 | 3 |
| SYCE2 | NXPH3 | 0.551505 | 4 | 0 | 3 |
| SYCE2 | HOXA11-AS | 0.55145 | 4 | 0 | 3 |
| SYCE2 | RUNDC3A | 0.535178 | 4 | 0 | 3 |
| SYCE2 | MYLK-AS1 | 0.533149 | 5 | 0 | 3 |
| SYCE2 | DKKL1 | 0.520952 | 3 | 0 | 3 |
| SYCE2 | TNFSF11 | 0.507836 | 4 | 0 | 3 |
For details and further investigation, click here