| Full name: thrombospondin 3 | Alias Symbol: | ||
| Type: protein-coding gene | Cytoband: 1q22 | ||
| Entrez ID: 7059 | HGNC ID: HGNC:11787 | Ensembl Gene: ENSG00000169231 | OMIM ID: 188062 |
THBS3 involved pathways:
| KEGG pathway | Description | View |
|---|---|---|
| hsa04151 | PI3K-Akt signaling pathway | |
| hsa04510 | Focal adhesion |
Expression of THBS3:
| Dataset | Gene | EntrezID | Probe | Log2FC | Adj.pValue | Expression |
|---|---|---|---|---|---|---|
| GSE17351 | THBS3 | 7059 | 209561_at | 0.0054 | 0.9957 | |
| GSE20347 | THBS3 | 7059 | 209561_at | -0.0220 | 0.8854 | |
| GSE23400 | THBS3 | 7059 | 209561_at | -0.0065 | 0.9317 | |
| GSE26886 | THBS3 | 7059 | 209561_at | 0.0104 | 0.9648 | |
| GSE29001 | THBS3 | 7059 | 209561_at | -0.1263 | 0.6954 | |
| GSE38129 | THBS3 | 7059 | 209561_at | -0.2054 | 0.1870 | |
| GSE45670 | THBS3 | 7059 | 209561_at | -0.2598 | 0.0825 | |
| GSE53622 | THBS3 | 7059 | 86351 | 0.2418 | 0.0152 | |
| GSE53624 | THBS3 | 7059 | 86351 | 0.2075 | 0.0015 | |
| GSE63941 | THBS3 | 7059 | 209561_at | -0.9042 | 0.0076 | |
| GSE77861 | THBS3 | 7059 | 209561_at | 0.4021 | 0.1516 | |
| GSE97050 | THBS3 | 7059 | A_23_P201047 | -0.1386 | 0.6270 | |
| SRP007169 | THBS3 | 7059 | RNAseq | -0.1226 | 0.7759 | |
| SRP008496 | THBS3 | 7059 | RNAseq | 0.5652 | 0.1398 | |
| SRP064894 | THBS3 | 7059 | RNAseq | 0.8919 | 0.0004 | |
| SRP133303 | THBS3 | 7059 | RNAseq | -0.0069 | 0.9787 | |
| SRP159526 | THBS3 | 7059 | RNAseq | 0.2232 | 0.4148 | |
| SRP193095 | THBS3 | 7059 | RNAseq | 0.3292 | 0.0121 | |
| SRP219564 | THBS3 | 7059 | RNAseq | 0.6863 | 0.1849 | |
| TCGA | THBS3 | 7059 | RNAseq | -0.1203 | 0.1247 |
Upregulated datasets: 0; Downregulated datasets: 0.
Survival by THBS3 expression:
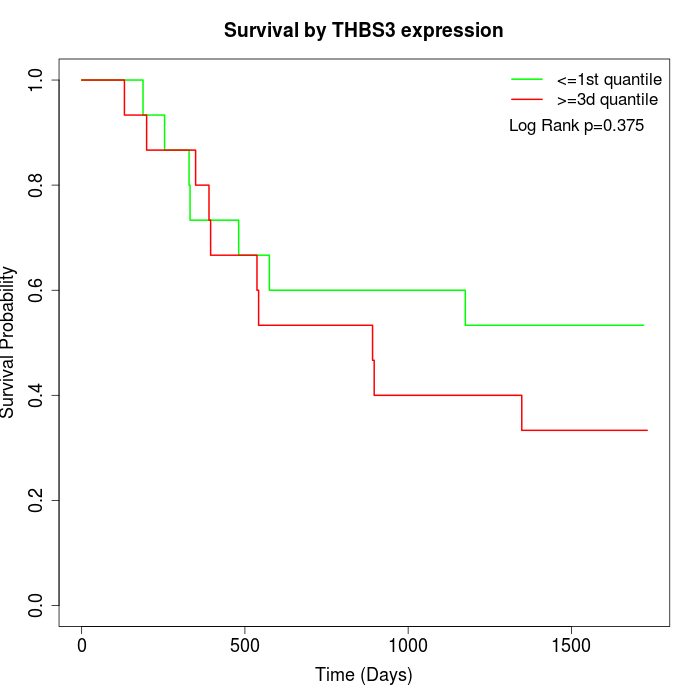 | 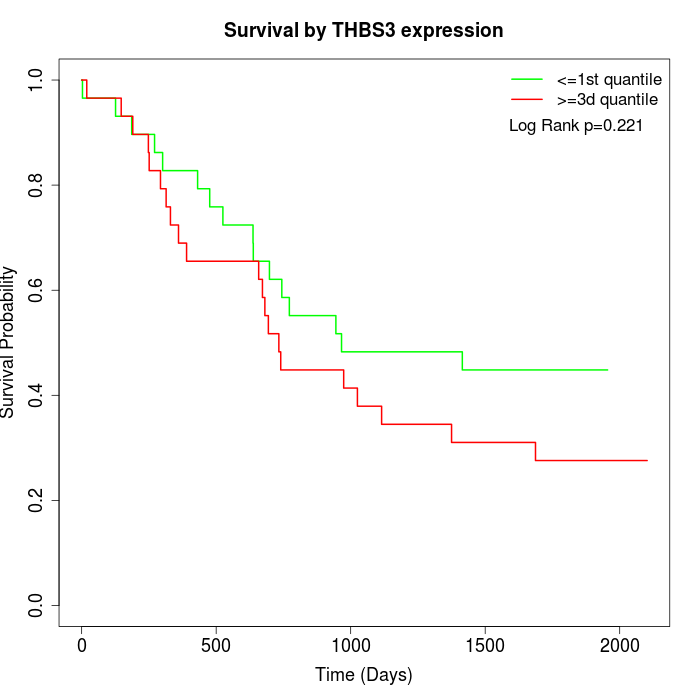 | 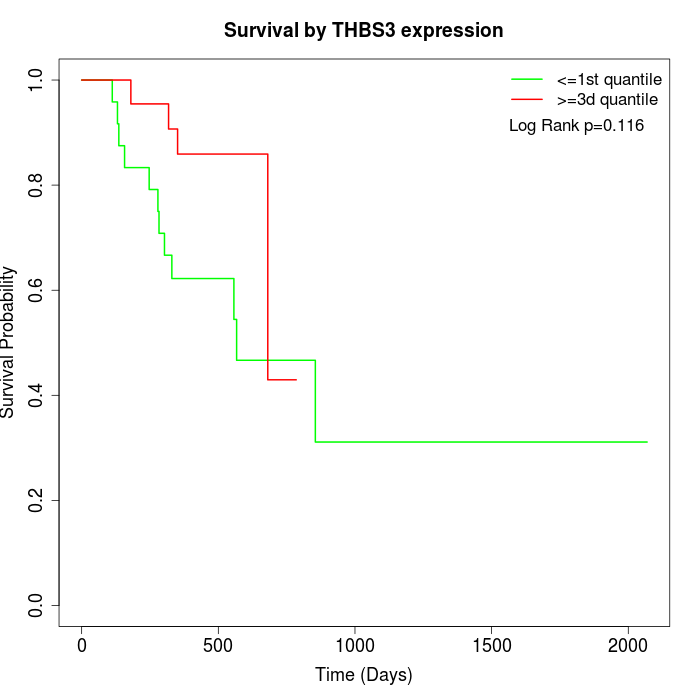 |
| GSE53622 | GSE53624 | TCGA |
Note: Click image to view full size file.
Copy number change of THBS3:
| Dataset | Gene | EntrezID | Gain | Loss | Normal | Detail |
|---|---|---|---|---|---|---|
| GSE15526 | THBS3 | 7059 | 14 | 0 | 16 | |
| GSE20123 | THBS3 | 7059 | 13 | 0 | 17 | |
| GSE43470 | THBS3 | 7059 | 7 | 2 | 34 | |
| GSE46452 | THBS3 | 7059 | 2 | 1 | 56 | |
| GSE47630 | THBS3 | 7059 | 14 | 0 | 26 | |
| GSE54993 | THBS3 | 7059 | 0 | 4 | 66 | |
| GSE54994 | THBS3 | 7059 | 16 | 0 | 37 | |
| GSE60625 | THBS3 | 7059 | 0 | 0 | 11 | |
| GSE74703 | THBS3 | 7059 | 7 | 1 | 28 | |
| GSE74704 | THBS3 | 7059 | 6 | 0 | 14 | |
| TCGA | THBS3 | 7059 | 38 | 2 | 56 |
Total number of gains: 117; Total number of losses: 10; Total Number of normals: 361.
Somatic mutations of THBS3:
Generating mutation plots.
Highly correlated genes for THBS3:
Showing top 20/173 corelated genes with mean PCC>0.5.
| Gene1 | Gene2 | Mean PCC | Num. Datasets | Num. PCC<0 | Num. PCC>0.5 |
|---|---|---|---|---|---|
| THBS3 | PCDH10 | 0.720895 | 3 | 0 | 3 |
| THBS3 | TCEAL7 | 0.669396 | 4 | 0 | 4 |
| THBS3 | SFRP1 | 0.665592 | 3 | 0 | 3 |
| THBS3 | KCNQ1OT1 | 0.663482 | 3 | 0 | 3 |
| THBS3 | NLGN2 | 0.661412 | 4 | 0 | 4 |
| THBS3 | CMYA5 | 0.654603 | 4 | 0 | 3 |
| THBS3 | TMEM155 | 0.65409 | 3 | 0 | 3 |
| THBS3 | SH3BP5-AS1 | 0.646891 | 3 | 0 | 3 |
| THBS3 | HMCN1 | 0.641686 | 3 | 0 | 3 |
| THBS3 | ALDH8A1 | 0.620633 | 3 | 0 | 3 |
| THBS3 | CYB5D2 | 0.61909 | 3 | 0 | 3 |
| THBS3 | GALNT15 | 0.618483 | 4 | 0 | 3 |
| THBS3 | COL6A3 | 0.613463 | 3 | 0 | 3 |
| THBS3 | BAHCC1 | 0.605626 | 3 | 0 | 3 |
| THBS3 | PLA2G4C | 0.60374 | 6 | 0 | 5 |
| THBS3 | FBXO31 | 0.599016 | 5 | 0 | 3 |
| THBS3 | LIX1L | 0.597735 | 3 | 0 | 3 |
| THBS3 | COL16A1 | 0.596887 | 7 | 0 | 5 |
| THBS3 | MAFK | 0.596824 | 3 | 0 | 3 |
| THBS3 | RARRES2 | 0.594972 | 7 | 0 | 5 |
For details and further investigation, click here