| Full name: tumor protein p53 binding protein 2 | Alias Symbol: PPP1R13A|ASPP2|53BP2 | ||
| Type: protein-coding gene | Cytoband: 1q41 | ||
| Entrez ID: 7159 | HGNC ID: HGNC:12000 | Ensembl Gene: ENSG00000143514 | OMIM ID: 602143 |
Screen Evidence:
| |||
TP53BP2 involved pathways:
| KEGG pathway | Description | View |
|---|---|---|
| hsa04390 | Hippo signaling pathway |
Expression of TP53BP2:
| Dataset | Gene | EntrezID | Probe | Log2FC | Adj.pValue | Expression |
|---|---|---|---|---|---|---|
| GSE17351 | TP53BP2 | 7159 | 203120_at | 0.0470 | 0.9285 | |
| GSE20347 | TP53BP2 | 7159 | 203120_at | 0.1087 | 0.5044 | |
| GSE23400 | TP53BP2 | 7159 | 203120_at | -0.2855 | 0.0033 | |
| GSE26886 | TP53BP2 | 7159 | 203120_at | -1.1015 | 0.0025 | |
| GSE29001 | TP53BP2 | 7159 | 203120_at | -0.0675 | 0.8905 | |
| GSE38129 | TP53BP2 | 7159 | 203120_at | 0.1327 | 0.3063 | |
| GSE45670 | TP53BP2 | 7159 | 203120_at | -0.0479 | 0.8316 | |
| GSE53622 | TP53BP2 | 7159 | 50876 | -0.1940 | 0.0428 | |
| GSE53624 | TP53BP2 | 7159 | 50876 | -0.4992 | 0.0000 | |
| GSE63941 | TP53BP2 | 7159 | 203120_at | -0.3526 | 0.2708 | |
| GSE77861 | TP53BP2 | 7159 | 203120_at | -0.0531 | 0.8493 | |
| GSE97050 | TP53BP2 | 7159 | A_23_P12526 | -0.0704 | 0.8536 | |
| SRP007169 | TP53BP2 | 7159 | RNAseq | -1.5171 | 0.0070 | |
| SRP008496 | TP53BP2 | 7159 | RNAseq | -1.6104 | 0.0000 | |
| SRP064894 | TP53BP2 | 7159 | RNAseq | -1.1910 | 0.0000 | |
| SRP133303 | TP53BP2 | 7159 | RNAseq | -0.2650 | 0.1100 | |
| SRP159526 | TP53BP2 | 7159 | RNAseq | -0.4397 | 0.2131 | |
| SRP193095 | TP53BP2 | 7159 | RNAseq | -0.8587 | 0.0000 | |
| SRP219564 | TP53BP2 | 7159 | RNAseq | -0.5604 | 0.0504 | |
| TCGA | TP53BP2 | 7159 | RNAseq | -0.0266 | 0.5781 |
Upregulated datasets: 0; Downregulated datasets: 4.
Survival by TP53BP2 expression:
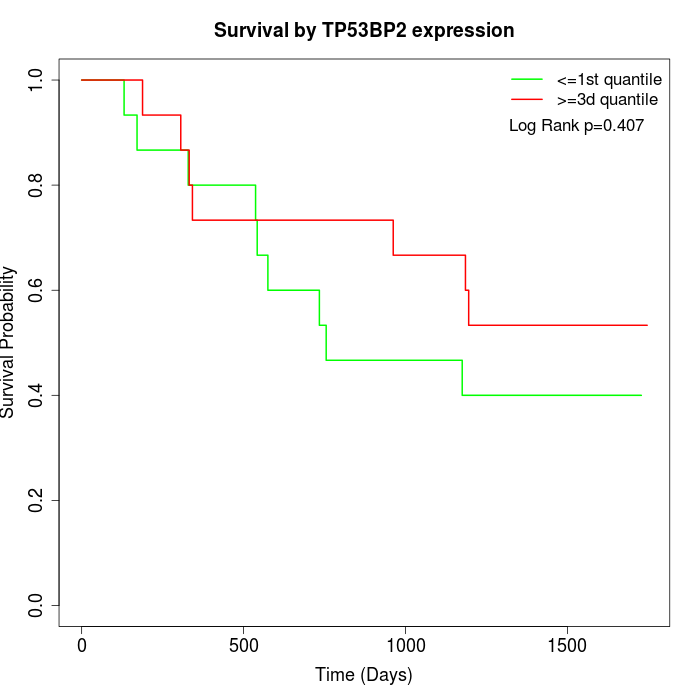 | 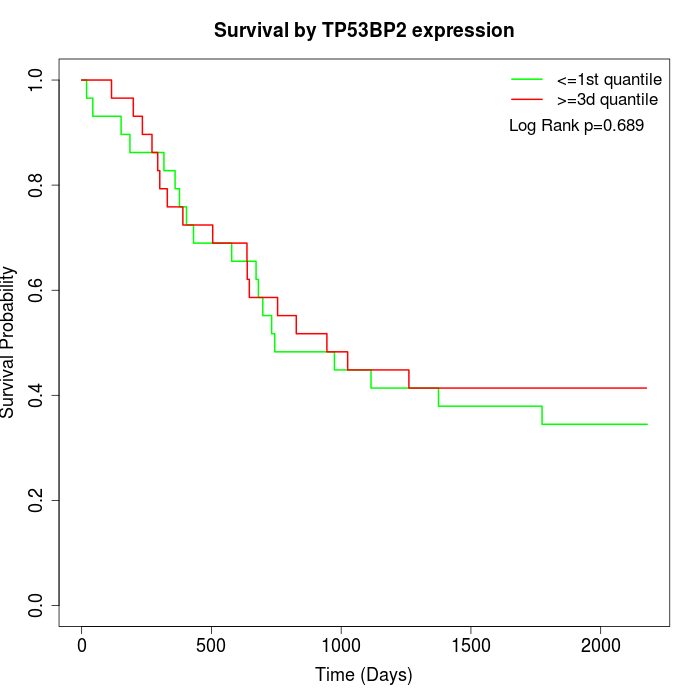 | 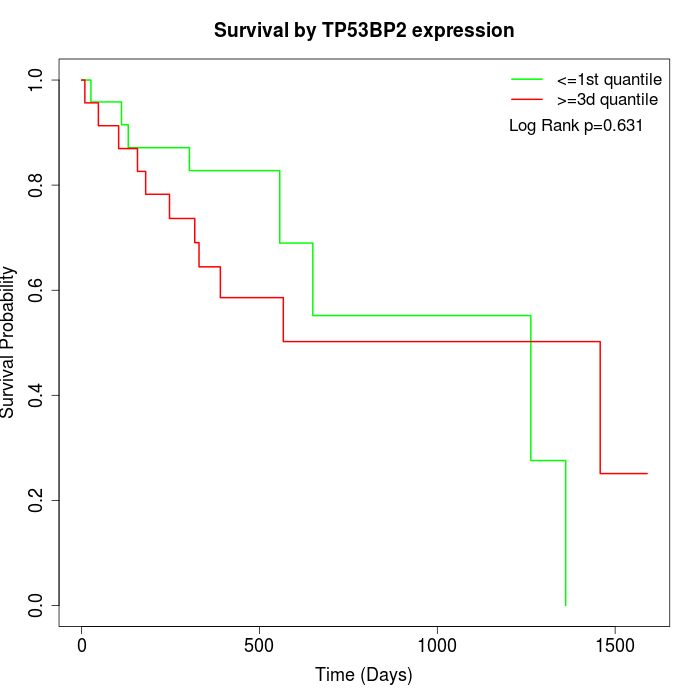 |
| GSE53622 | GSE53624 | TCGA |
Note: Click image to view full size file.
Copy number change of TP53BP2:
| Dataset | Gene | EntrezID | Gain | Loss | Normal | Detail |
|---|---|---|---|---|---|---|
| GSE15526 | TP53BP2 | 7159 | 10 | 0 | 20 | |
| GSE20123 | TP53BP2 | 7159 | 10 | 0 | 20 | |
| GSE43470 | TP53BP2 | 7159 | 8 | 0 | 35 | |
| GSE46452 | TP53BP2 | 7159 | 3 | 1 | 55 | |
| GSE47630 | TP53BP2 | 7159 | 15 | 0 | 25 | |
| GSE54993 | TP53BP2 | 7159 | 0 | 6 | 64 | |
| GSE54994 | TP53BP2 | 7159 | 16 | 0 | 37 | |
| GSE60625 | TP53BP2 | 7159 | 0 | 0 | 11 | |
| GSE74703 | TP53BP2 | 7159 | 8 | 0 | 28 | |
| GSE74704 | TP53BP2 | 7159 | 4 | 0 | 16 | |
| TCGA | TP53BP2 | 7159 | 46 | 4 | 46 |
Total number of gains: 120; Total number of losses: 11; Total Number of normals: 357.
Somatic mutations of TP53BP2:
Generating mutation plots.
Highly correlated genes for TP53BP2:
Showing top 20/176 corelated genes with mean PCC>0.5.
| Gene1 | Gene2 | Mean PCC | Num. Datasets | Num. PCC<0 | Num. PCC>0.5 |
|---|---|---|---|---|---|
| TP53BP2 | ZNF672 | 0.822697 | 3 | 0 | 3 |
| TP53BP2 | PPM1B | 0.782625 | 3 | 0 | 3 |
| TP53BP2 | ZNF92 | 0.775678 | 3 | 0 | 3 |
| TP53BP2 | CNST | 0.759005 | 4 | 0 | 4 |
| TP53BP2 | C5orf51 | 0.73237 | 3 | 0 | 3 |
| TP53BP2 | AMBRA1 | 0.729687 | 3 | 0 | 3 |
| TP53BP2 | FYCO1 | 0.728818 | 3 | 0 | 3 |
| TP53BP2 | C6orf62 | 0.726403 | 3 | 0 | 3 |
| TP53BP2 | CTDSPL | 0.722955 | 3 | 0 | 3 |
| TP53BP2 | ZNF555 | 0.721589 | 3 | 0 | 3 |
| TP53BP2 | AK3 | 0.721067 | 3 | 0 | 3 |
| TP53BP2 | RAB5B | 0.718517 | 3 | 0 | 3 |
| TP53BP2 | PPP1R15A | 0.694688 | 3 | 0 | 3 |
| TP53BP2 | BRK1 | 0.691329 | 3 | 0 | 3 |
| TP53BP2 | CGGBP1 | 0.690892 | 3 | 0 | 3 |
| TP53BP2 | AKAP17A | 0.687839 | 3 | 0 | 3 |
| TP53BP2 | RNPC3 | 0.685602 | 3 | 0 | 3 |
| TP53BP2 | FIG4 | 0.684518 | 3 | 0 | 3 |
| TP53BP2 | MYNN | 0.680399 | 3 | 0 | 3 |
| TP53BP2 | FAM122C | 0.680037 | 5 | 0 | 4 |
For details and further investigation, click here