| Full name: TPT1 antisense RNA 1 | Alias Symbol: | ||
| Type: non-coding RNA | Cytoband: 13q14.13 | ||
| Entrez ID: 100190939 | HGNC ID: HGNC:43686 | Ensembl Gene: ENSG00000170919 | OMIM ID: |
Expression of TPT1-AS1:
| Dataset | Gene | EntrezID | Probe | Log2FC | Adj.pValue | Expression |
|---|---|---|---|---|---|---|
| GSE17351 | TPT1-AS1 | 100190939 | 227710_s_at | -0.1280 | 0.8405 | |
| GSE26886 | TPT1-AS1 | 100190939 | 227710_s_at | 0.3533 | 0.1100 | |
| GSE45670 | TPT1-AS1 | 100190939 | 227710_s_at | 0.0053 | 0.9759 | |
| GSE53622 | TPT1-AS1 | 100190939 | 98130 | -0.2342 | 0.0000 | |
| GSE53624 | TPT1-AS1 | 100190939 | 3885 | -0.0008 | 0.9847 | |
| GSE63941 | TPT1-AS1 | 100190939 | 228913_at | -0.9996 | 0.0078 | |
| GSE77861 | TPT1-AS1 | 100190939 | 227710_s_at | 0.0468 | 0.7328 | |
| SRP007169 | TPT1-AS1 | 100190939 | RNAseq | -0.5571 | 0.4211 | |
| SRP064894 | TPT1-AS1 | 100190939 | RNAseq | -0.0724 | 0.7470 | |
| SRP133303 | TPT1-AS1 | 100190939 | RNAseq | -0.4149 | 0.0226 | |
| SRP159526 | TPT1-AS1 | 100190939 | RNAseq | -0.4788 | 0.4083 | |
| SRP193095 | TPT1-AS1 | 100190939 | RNAseq | -0.3105 | 0.0532 | |
| SRP219564 | TPT1-AS1 | 100190939 | RNAseq | -0.3404 | 0.4468 |
Upregulated datasets: 0; Downregulated datasets: 0.
Survival by TPT1-AS1 expression:
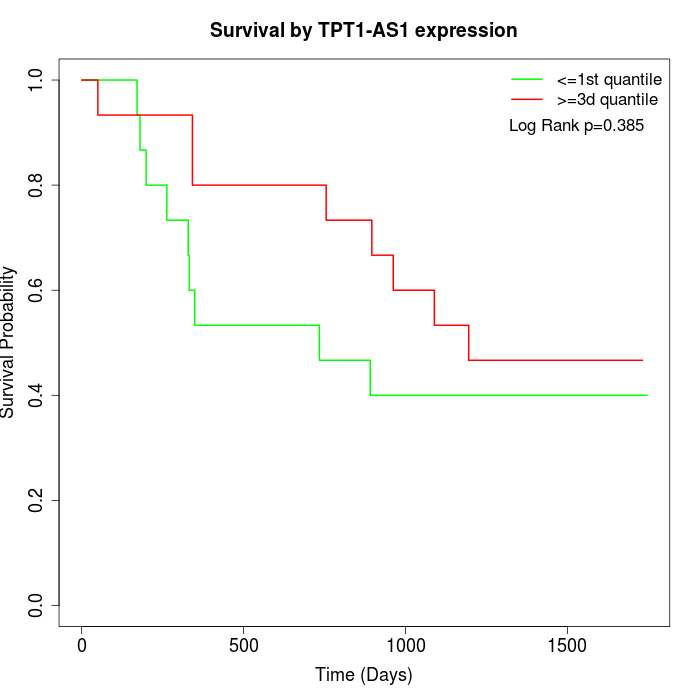 | 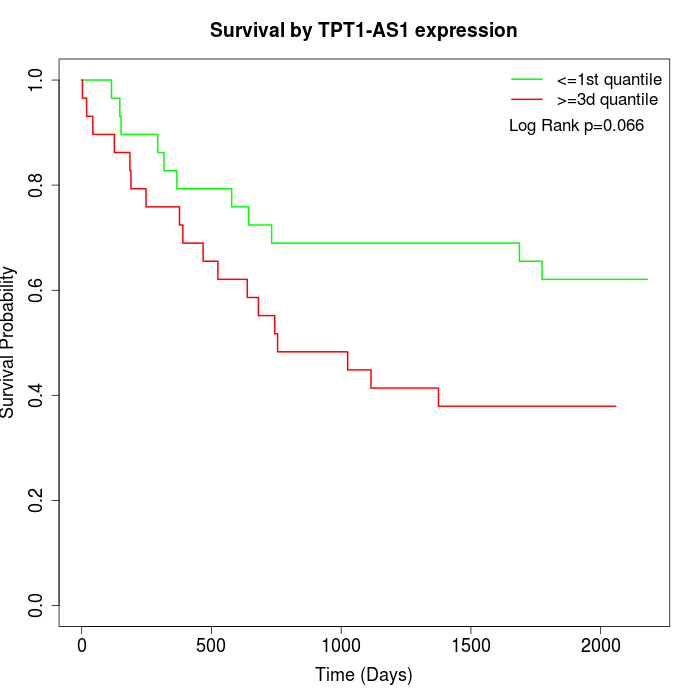 |
| GSE53622 | GSE53624 |
Note: Click image to view full size file.
Copy number change of TPT1-AS1:
| Dataset | Gene | EntrezID | Gain | Loss | Normal | Detail |
|---|---|---|---|---|---|---|
| GSE15526 | TPT1-AS1 | 100190939 | 0 | 13 | 17 | |
| GSE20123 | TPT1-AS1 | 100190939 | 0 | 12 | 18 | |
| GSE43470 | TPT1-AS1 | 100190939 | 3 | 13 | 27 | |
| GSE46452 | TPT1-AS1 | 100190939 | 0 | 33 | 26 | |
| GSE47630 | TPT1-AS1 | 100190939 | 2 | 27 | 11 | |
| GSE54993 | TPT1-AS1 | 100190939 | 12 | 2 | 56 | |
| GSE54994 | TPT1-AS1 | 100190939 | 1 | 16 | 36 | |
| GSE60625 | TPT1-AS1 | 100190939 | 0 | 3 | 8 | |
| GSE74703 | TPT1-AS1 | 100190939 | 3 | 10 | 23 | |
| GSE74704 | TPT1-AS1 | 100190939 | 0 | 9 | 11 |
Total number of gains: 21; Total number of losses: 138; Total Number of normals: 233.
Somatic mutations of TPT1-AS1:
Generating mutation plots.
Highly correlated genes for TPT1-AS1:
Showing all 15 correlated genes with mean PCC>0.5.
| Gene1 | Gene2 | Mean PCC | Num. Datasets | Num. PCC<0 | Num. PCC>0.5 |
|---|---|---|---|---|---|
| TPT1-AS1 | UGGT2 | 0.628755 | 3 | 0 | 3 |
| TPT1-AS1 | KLC1 | 0.625095 | 3 | 0 | 3 |
| TPT1-AS1 | WDR19 | 0.61087 | 4 | 0 | 3 |
| TPT1-AS1 | BRI3 | 0.563154 | 3 | 0 | 3 |
| TPT1-AS1 | GRIK2 | 0.560307 | 4 | 0 | 3 |
| TPT1-AS1 | TUBG2 | 0.534494 | 4 | 0 | 3 |
| TPT1-AS1 | CORO2B | 0.526959 | 5 | 0 | 3 |
| TPT1-AS1 | WTIP | 0.526634 | 4 | 0 | 3 |
| TPT1-AS1 | DPP7 | 0.522927 | 4 | 0 | 3 |
| TPT1-AS1 | ZFPM2 | 0.521225 | 4 | 0 | 3 |
| TPT1-AS1 | ZNF790-AS1 | 0.52043 | 3 | 0 | 3 |
| TPT1-AS1 | MAN1B1 | 0.518984 | 5 | 0 | 3 |
| TPT1-AS1 | ADD1 | 0.518936 | 4 | 0 | 3 |
| TPT1-AS1 | CC2D2A | 0.511834 | 4 | 0 | 3 |
| TPT1-AS1 | GPSM1 | 0.507062 | 5 | 0 | 3 |
For details and further investigation, click here