| Full name: G protein signaling modulator 1 | Alias Symbol: AGS3|DKFZP727I051 | ||
| Type: protein-coding gene | Cytoband: 9q34.3 | ||
| Entrez ID: 26086 | HGNC ID: HGNC:17858 | Ensembl Gene: ENSG00000160360 | OMIM ID: 609491 |
GPSM1 involved pathways:
| KEGG pathway | Description | View |
|---|---|---|
| hsa05030 | Cocaine addiction |
Expression of GPSM1:
| Dataset | Gene | EntrezID | Probe | Log2FC | Adj.pValue | Expression |
|---|---|---|---|---|---|---|
| GSE17351 | GPSM1 | 26086 | 226043_at | 0.2659 | 0.5345 | |
| GSE26886 | GPSM1 | 26086 | 226043_at | 1.0237 | 0.0006 | |
| GSE45670 | GPSM1 | 26086 | 226043_at | 0.2553 | 0.3312 | |
| GSE53622 | GPSM1 | 26086 | 129028 | -0.2103 | 0.0054 | |
| GSE53624 | GPSM1 | 26086 | 129028 | -0.2297 | 0.0359 | |
| GSE63941 | GPSM1 | 26086 | 226043_at | -0.7760 | 0.2153 | |
| GSE77861 | GPSM1 | 26086 | 226043_at | 0.2865 | 0.2798 | |
| GSE97050 | GPSM1 | 26086 | A_33_P3293247 | -0.1633 | 0.5833 | |
| SRP007169 | GPSM1 | 26086 | RNAseq | -0.9632 | 0.2962 | |
| SRP008496 | GPSM1 | 26086 | RNAseq | 0.1664 | 0.7655 | |
| SRP064894 | GPSM1 | 26086 | RNAseq | 1.2558 | 0.0013 | |
| SRP133303 | GPSM1 | 26086 | RNAseq | 0.6874 | 0.0349 | |
| SRP159526 | GPSM1 | 26086 | RNAseq | 1.9315 | 0.0002 | |
| SRP193095 | GPSM1 | 26086 | RNAseq | 1.6776 | 0.0000 | |
| SRP219564 | GPSM1 | 26086 | RNAseq | 1.0998 | 0.0374 | |
| TCGA | GPSM1 | 26086 | RNAseq | -0.0796 | 0.4259 |
Upregulated datasets: 5; Downregulated datasets: 0.
Survival by GPSM1 expression:
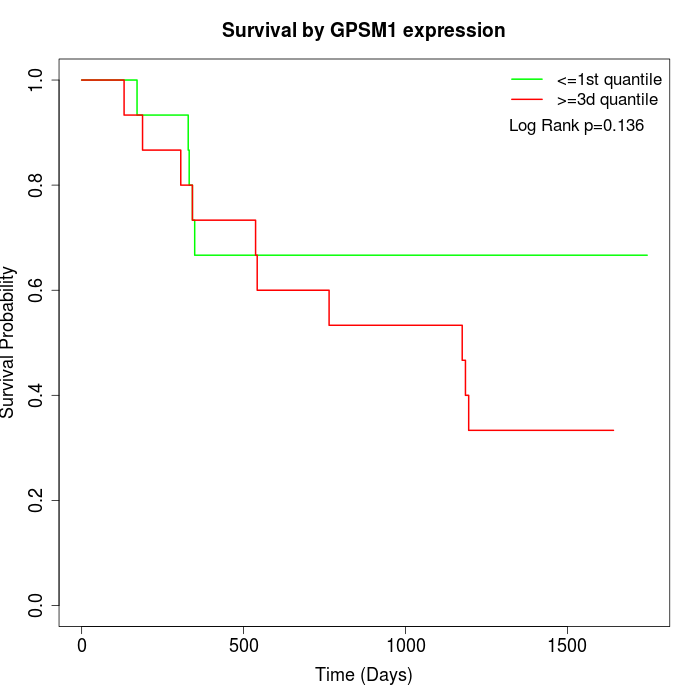 | 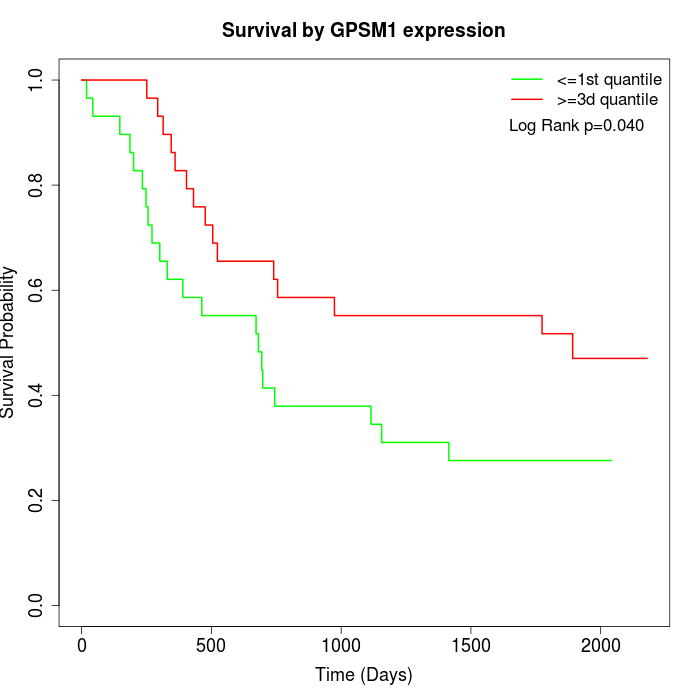 |  |
| GSE53622 | GSE53624 | TCGA |
Note: Click image to view full size file.
Copy number change of GPSM1:
| Dataset | Gene | EntrezID | Gain | Loss | Normal | Detail |
|---|---|---|---|---|---|---|
| GSE15526 | GPSM1 | 26086 | 4 | 7 | 19 | |
| GSE20123 | GPSM1 | 26086 | 4 | 7 | 19 | |
| GSE43470 | GPSM1 | 26086 | 3 | 7 | 33 | |
| GSE46452 | GPSM1 | 26086 | 6 | 13 | 40 | |
| GSE47630 | GPSM1 | 26086 | 6 | 15 | 19 | |
| GSE54993 | GPSM1 | 26086 | 3 | 3 | 64 | |
| GSE54994 | GPSM1 | 26086 | 13 | 7 | 33 | |
| GSE60625 | GPSM1 | 26086 | 0 | 0 | 11 | |
| GSE74703 | GPSM1 | 26086 | 3 | 5 | 28 | |
| GSE74704 | GPSM1 | 26086 | 2 | 5 | 13 | |
| TCGA | GPSM1 | 26086 | 29 | 24 | 43 |
Total number of gains: 73; Total number of losses: 93; Total Number of normals: 322.
Somatic mutations of GPSM1:
Generating mutation plots.
Highly correlated genes for GPSM1:
Showing top 20/236 corelated genes with mean PCC>0.5.
| Gene1 | Gene2 | Mean PCC | Num. Datasets | Num. PCC<0 | Num. PCC>0.5 |
|---|---|---|---|---|---|
| GPSM1 | FAM180B | 0.789928 | 3 | 0 | 3 |
| GPSM1 | TDGF1 | 0.741263 | 3 | 0 | 3 |
| GPSM1 | SUN5 | 0.726202 | 4 | 0 | 4 |
| GPSM1 | SPACA3 | 0.725001 | 3 | 0 | 3 |
| GPSM1 | CCDC78 | 0.715416 | 4 | 0 | 3 |
| GPSM1 | KATNAL2 | 0.71443 | 4 | 0 | 4 |
| GPSM1 | GPD1 | 0.711759 | 4 | 0 | 4 |
| GPSM1 | CHMP6 | 0.710138 | 3 | 0 | 3 |
| GPSM1 | USH1C | 0.708034 | 3 | 0 | 3 |
| GPSM1 | LGALS12 | 0.698991 | 3 | 0 | 3 |
| GPSM1 | CCL27 | 0.696779 | 3 | 0 | 3 |
| GPSM1 | KCNJ9 | 0.696581 | 3 | 0 | 3 |
| GPSM1 | NKX3-2 | 0.684152 | 3 | 0 | 3 |
| GPSM1 | SYT2 | 0.68161 | 3 | 0 | 3 |
| GPSM1 | TMEM174 | 0.673806 | 3 | 0 | 3 |
| GPSM1 | SCARA5 | 0.665771 | 3 | 0 | 3 |
| GPSM1 | CRYGA | 0.664419 | 5 | 0 | 5 |
| GPSM1 | PNPLA7 | 0.66426 | 5 | 0 | 5 |
| GPSM1 | RFPL3S | 0.663247 | 3 | 0 | 3 |
| GPSM1 | RBAKDN | 0.657337 | 3 | 0 | 3 |
For details and further investigation, click here