| Full name: tubulin gamma 2 | Alias Symbol: | ||
| Type: protein-coding gene | Cytoband: 17q21.2 | ||
| Entrez ID: 27175 | HGNC ID: HGNC:12419 | Ensembl Gene: ENSG00000037042 | OMIM ID: 605785 |
Screen Evidence:
| |||
Expression of TUBG2:
| Dataset | Gene | EntrezID | Probe | Log2FC | Adj.pValue | Expression |
|---|---|---|---|---|---|---|
| GSE17351 | TUBG2 | 27175 | 203894_at | 0.1515 | 0.8498 | |
| GSE20347 | TUBG2 | 27175 | 203894_at | 0.4856 | 0.0001 | |
| GSE23400 | TUBG2 | 27175 | 203894_at | 0.1870 | 0.0000 | |
| GSE26886 | TUBG2 | 27175 | 203894_at | 0.7985 | 0.0000 | |
| GSE29001 | TUBG2 | 27175 | 203894_at | 0.7268 | 0.0118 | |
| GSE38129 | TUBG2 | 27175 | 203894_at | 0.1840 | 0.3262 | |
| GSE45670 | TUBG2 | 27175 | 203894_at | 0.1526 | 0.4052 | |
| GSE53622 | TUBG2 | 27175 | 4906 | 0.3909 | 0.0000 | |
| GSE53624 | TUBG2 | 27175 | 4906 | 0.6438 | 0.0000 | |
| GSE63941 | TUBG2 | 27175 | 203894_at | 0.0886 | 0.8136 | |
| GSE77861 | TUBG2 | 27175 | 203894_at | 0.4406 | 0.0271 | |
| GSE97050 | TUBG2 | 27175 | A_23_P78014 | 0.3556 | 0.2992 | |
| SRP007169 | TUBG2 | 27175 | RNAseq | 1.0849 | 0.0878 | |
| SRP008496 | TUBG2 | 27175 | RNAseq | 0.8745 | 0.0320 | |
| SRP064894 | TUBG2 | 27175 | RNAseq | 0.9331 | 0.0000 | |
| SRP133303 | TUBG2 | 27175 | RNAseq | 0.0193 | 0.9171 | |
| SRP159526 | TUBG2 | 27175 | RNAseq | 0.7469 | 0.0715 | |
| SRP193095 | TUBG2 | 27175 | RNAseq | 0.8820 | 0.0000 | |
| SRP219564 | TUBG2 | 27175 | RNAseq | 0.2112 | 0.6014 | |
| TCGA | TUBG2 | 27175 | RNAseq | -0.1664 | 0.0107 |
Upregulated datasets: 0; Downregulated datasets: 0.
Survival by TUBG2 expression:
 | 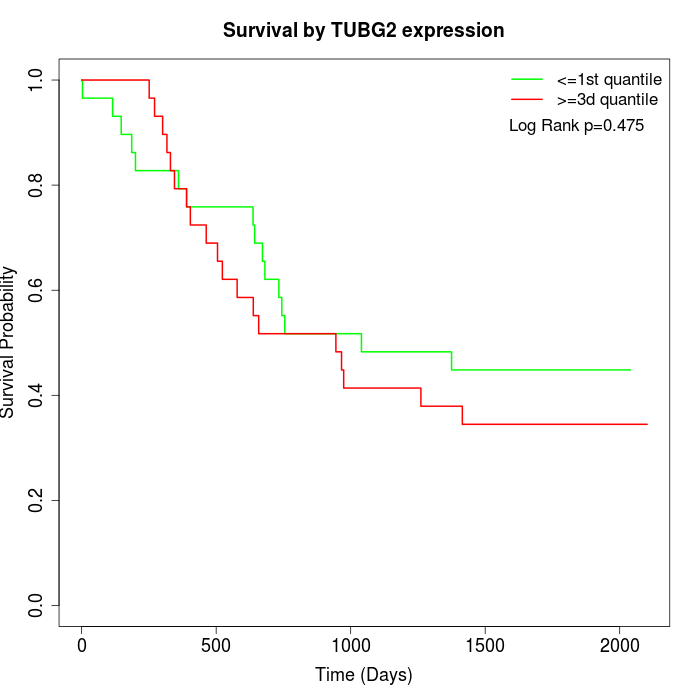 | 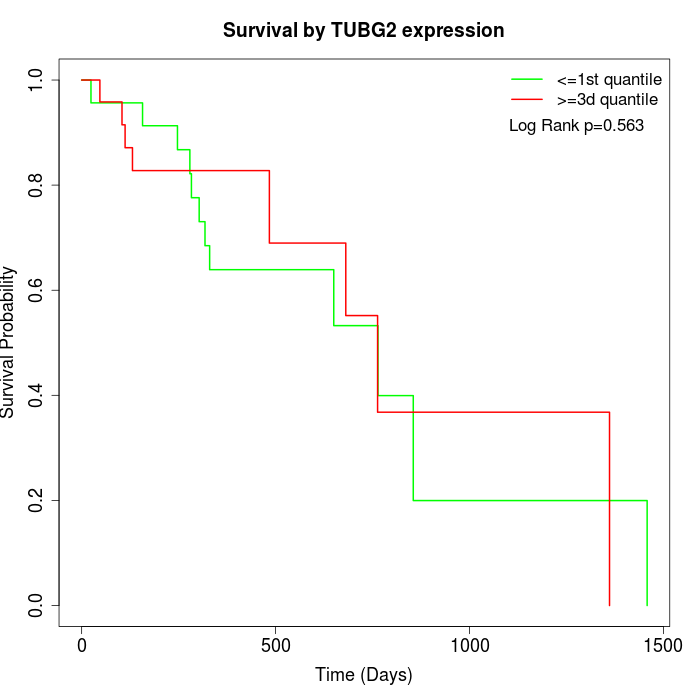 |
| GSE53622 | GSE53624 | TCGA |
Note: Click image to view full size file.
Copy number change of TUBG2:
| Dataset | Gene | EntrezID | Gain | Loss | Normal | Detail |
|---|---|---|---|---|---|---|
| GSE15526 | TUBG2 | 27175 | 6 | 2 | 22 | |
| GSE20123 | TUBG2 | 27175 | 6 | 2 | 22 | |
| GSE43470 | TUBG2 | 27175 | 1 | 2 | 40 | |
| GSE46452 | TUBG2 | 27175 | 34 | 0 | 25 | |
| GSE47630 | TUBG2 | 27175 | 8 | 1 | 31 | |
| GSE54993 | TUBG2 | 27175 | 3 | 4 | 63 | |
| GSE54994 | TUBG2 | 27175 | 8 | 5 | 40 | |
| GSE60625 | TUBG2 | 27175 | 4 | 0 | 7 | |
| GSE74703 | TUBG2 | 27175 | 1 | 1 | 34 | |
| GSE74704 | TUBG2 | 27175 | 4 | 1 | 15 | |
| TCGA | TUBG2 | 27175 | 23 | 6 | 67 |
Total number of gains: 98; Total number of losses: 24; Total Number of normals: 366.
Somatic mutations of TUBG2:
Generating mutation plots.
Highly correlated genes for TUBG2:
Showing top 20/1299 corelated genes with mean PCC>0.5.
| Gene1 | Gene2 | Mean PCC | Num. Datasets | Num. PCC<0 | Num. PCC>0.5 |
|---|---|---|---|---|---|
| TUBG2 | VWA1 | 0.785407 | 3 | 0 | 3 |
| TUBG2 | RASA3 | 0.779244 | 3 | 0 | 3 |
| TUBG2 | CRTC2 | 0.759954 | 3 | 0 | 3 |
| TUBG2 | ZFAND3 | 0.755542 | 3 | 0 | 3 |
| TUBG2 | SGCE | 0.747781 | 4 | 0 | 4 |
| TUBG2 | RRAS | 0.726329 | 4 | 0 | 4 |
| TUBG2 | IQSEC1 | 0.722561 | 4 | 0 | 4 |
| TUBG2 | EVC | 0.719361 | 4 | 0 | 4 |
| TUBG2 | FLNB | 0.717364 | 3 | 0 | 3 |
| TUBG2 | NCOA6 | 0.71411 | 4 | 0 | 4 |
| TUBG2 | PLEKHA3 | 0.713589 | 4 | 0 | 4 |
| TUBG2 | EGFL7 | 0.712812 | 5 | 0 | 4 |
| TUBG2 | EMILIN2 | 0.712374 | 3 | 0 | 3 |
| TUBG2 | ALKBH6 | 0.711477 | 4 | 0 | 3 |
| TUBG2 | AP3D1 | 0.707514 | 3 | 0 | 3 |
| TUBG2 | CD93 | 0.702685 | 3 | 0 | 3 |
| TUBG2 | DYNC1LI2 | 0.702368 | 3 | 0 | 3 |
| TUBG2 | SCNM1 | 0.700039 | 3 | 0 | 3 |
| TUBG2 | PKIG | 0.698211 | 4 | 0 | 4 |
| TUBG2 | SVEP1 | 0.696456 | 4 | 0 | 4 |
For details and further investigation, click here