| Full name: trafficking kinesin protein 2 | Alias Symbol: CALS-C|KIAA0549|GRIF-1|OIP98|MILT2 | ||
| Type: protein-coding gene | Cytoband: 2q33.1 | ||
| Entrez ID: 66008 | HGNC ID: HGNC:13206 | Ensembl Gene: ENSG00000115993 | OMIM ID: 607334 |
Expression of TRAK2:
| Dataset | Gene | EntrezID | Probe | Log2FC | Adj.pValue | Expression |
|---|---|---|---|---|---|---|
| GSE17351 | TRAK2 | 66008 | 202125_s_at | -0.6242 | 0.2471 | |
| GSE20347 | TRAK2 | 66008 | 202125_s_at | -0.6886 | 0.0045 | |
| GSE23400 | TRAK2 | 66008 | 202125_s_at | -0.4864 | 0.0002 | |
| GSE26886 | TRAK2 | 66008 | 202125_s_at | -1.0849 | 0.0003 | |
| GSE29001 | TRAK2 | 66008 | 202125_s_at | -0.9982 | 0.0049 | |
| GSE38129 | TRAK2 | 66008 | 202125_s_at | -0.7774 | 0.0037 | |
| GSE45670 | TRAK2 | 66008 | 202125_s_at | -0.9329 | 0.0001 | |
| GSE53622 | TRAK2 | 66008 | 25996 | -0.4804 | 0.0000 | |
| GSE53624 | TRAK2 | 66008 | 25996 | -0.5783 | 0.0000 | |
| GSE63941 | TRAK2 | 66008 | 202125_s_at | -1.8523 | 0.0013 | |
| GSE77861 | TRAK2 | 66008 | 202125_s_at | -0.4479 | 0.1370 | |
| GSE97050 | TRAK2 | 66008 | A_23_P209426 | -0.4928 | 0.2628 | |
| SRP007169 | TRAK2 | 66008 | RNAseq | -0.7443 | 0.1508 | |
| SRP008496 | TRAK2 | 66008 | RNAseq | -0.3554 | 0.2662 | |
| SRP064894 | TRAK2 | 66008 | RNAseq | -0.4380 | 0.0310 | |
| SRP133303 | TRAK2 | 66008 | RNAseq | -0.2843 | 0.2238 | |
| SRP159526 | TRAK2 | 66008 | RNAseq | -0.4199 | 0.0142 | |
| SRP193095 | TRAK2 | 66008 | RNAseq | -0.5560 | 0.0000 | |
| SRP219564 | TRAK2 | 66008 | RNAseq | -0.5774 | 0.3044 | |
| TCGA | TRAK2 | 66008 | RNAseq | -0.3119 | 0.0000 |
Upregulated datasets: 0; Downregulated datasets: 2.
Survival by TRAK2 expression:
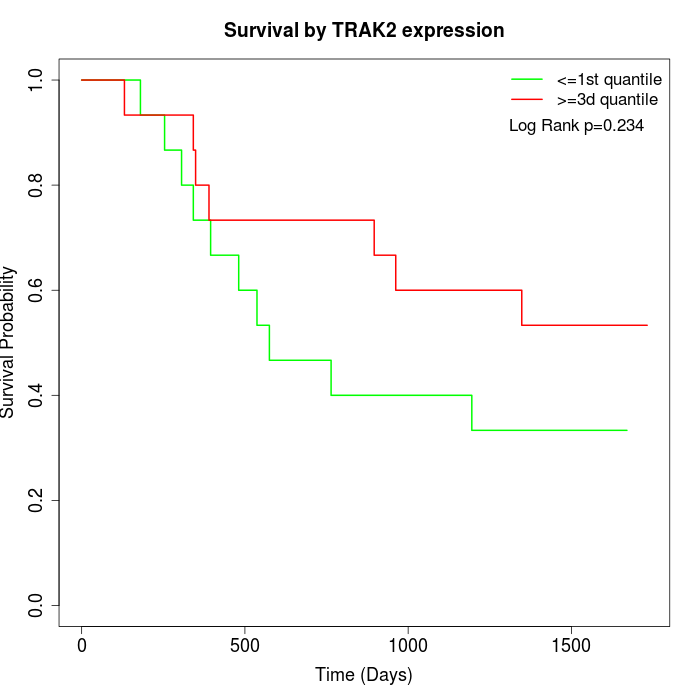 | 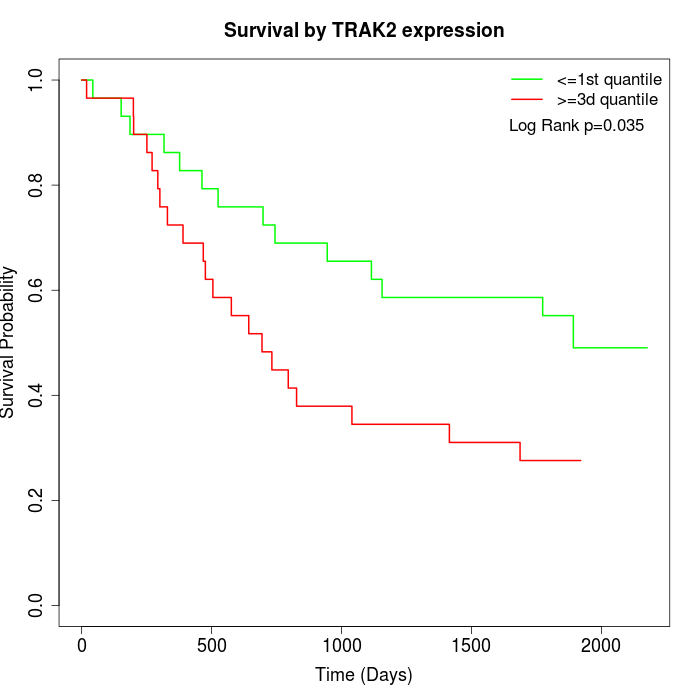 | 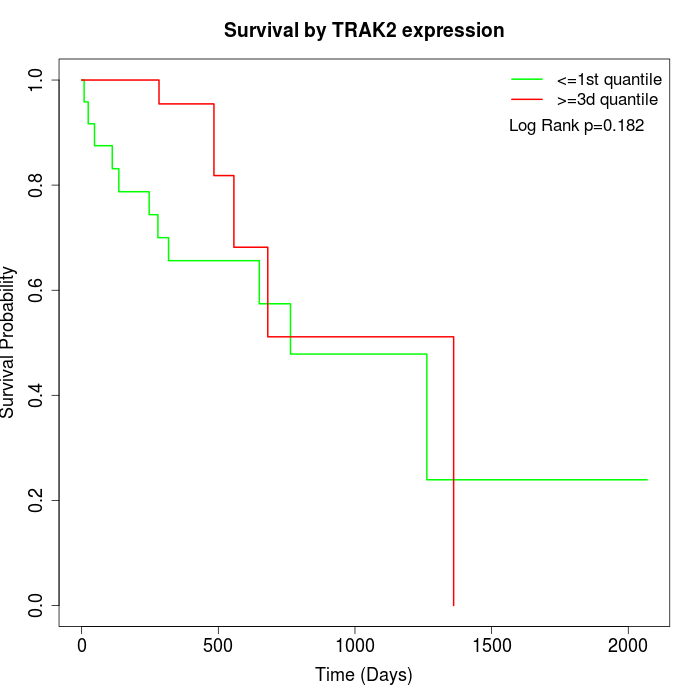 |
| GSE53622 | GSE53624 | TCGA |
Note: Click image to view full size file.
Copy number change of TRAK2:
| Dataset | Gene | EntrezID | Gain | Loss | Normal | Detail |
|---|---|---|---|---|---|---|
| GSE15526 | TRAK2 | 66008 | 5 | 4 | 21 | |
| GSE20123 | TRAK2 | 66008 | 5 | 4 | 21 | |
| GSE43470 | TRAK2 | 66008 | 1 | 1 | 41 | |
| GSE46452 | TRAK2 | 66008 | 1 | 4 | 54 | |
| GSE47630 | TRAK2 | 66008 | 4 | 5 | 31 | |
| GSE54993 | TRAK2 | 66008 | 0 | 3 | 67 | |
| GSE54994 | TRAK2 | 66008 | 10 | 8 | 35 | |
| GSE60625 | TRAK2 | 66008 | 0 | 3 | 8 | |
| GSE74703 | TRAK2 | 66008 | 1 | 1 | 34 | |
| GSE74704 | TRAK2 | 66008 | 2 | 2 | 16 | |
| TCGA | TRAK2 | 66008 | 19 | 14 | 63 |
Total number of gains: 48; Total number of losses: 49; Total Number of normals: 391.
Somatic mutations of TRAK2:
Generating mutation plots.
Highly correlated genes for TRAK2:
Showing top 20/1132 corelated genes with mean PCC>0.5.
| Gene1 | Gene2 | Mean PCC | Num. Datasets | Num. PCC<0 | Num. PCC>0.5 |
|---|---|---|---|---|---|
| TRAK2 | IQUB | 0.782395 | 3 | 0 | 3 |
| TRAK2 | FXYD1 | 0.763974 | 6 | 0 | 6 |
| TRAK2 | MGARP | 0.753253 | 3 | 0 | 3 |
| TRAK2 | ZBTB26 | 0.752949 | 3 | 0 | 3 |
| TRAK2 | GPRASP1 | 0.750914 | 8 | 0 | 8 |
| TRAK2 | C1QTNF7 | 0.748067 | 5 | 0 | 5 |
| TRAK2 | RBPMS2 | 0.742527 | 6 | 0 | 5 |
| TRAK2 | NEGR1 | 0.737258 | 6 | 0 | 5 |
| TRAK2 | SORCS1 | 0.730903 | 5 | 0 | 4 |
| TRAK2 | MICU3 | 0.728136 | 5 | 0 | 5 |
| TRAK2 | ANO5 | 0.723104 | 6 | 0 | 5 |
| TRAK2 | KANK2 | 0.722927 | 8 | 0 | 8 |
| TRAK2 | ILK | 0.721796 | 7 | 0 | 6 |
| TRAK2 | ARHGAP6 | 0.719951 | 10 | 0 | 9 |
| TRAK2 | XKR4 | 0.719734 | 5 | 0 | 5 |
| TRAK2 | SYNC | 0.717052 | 7 | 0 | 5 |
| TRAK2 | IL17D | 0.712711 | 5 | 0 | 5 |
| TRAK2 | FIBIN | 0.711155 | 5 | 0 | 4 |
| TRAK2 | TTC33 | 0.710228 | 3 | 0 | 3 |
| TRAK2 | JAZF1 | 0.706244 | 6 | 0 | 6 |
For details and further investigation, click here