| Full name: RNA binding protein, mRNA processing factor 2 | Alias Symbol: | ||
| Type: protein-coding gene | Cytoband: 15q22.31 | ||
| Entrez ID: 348093 | HGNC ID: HGNC:19098 | Ensembl Gene: ENSG00000166831 | OMIM ID: |
Expression of RBPMS2:
| Dataset | Gene | EntrezID | Probe | Log2FC | Adj.pValue | Expression |
|---|---|---|---|---|---|---|
| GSE17351 | RBPMS2 | 348093 | 228802_at | -1.7486 | 0.2037 | |
| GSE26886 | RBPMS2 | 348093 | 228802_at | 0.4653 | 0.1143 | |
| GSE45670 | RBPMS2 | 348093 | 228802_at | -2.2874 | 0.0000 | |
| GSE53622 | RBPMS2 | 348093 | 99548 | -2.4374 | 0.0000 | |
| GSE53624 | RBPMS2 | 348093 | 99548 | -2.0799 | 0.0000 | |
| GSE63941 | RBPMS2 | 348093 | 228802_at | -0.2390 | 0.7168 | |
| GSE77861 | RBPMS2 | 348093 | 228802_at | 0.1395 | 0.2630 | |
| GSE97050 | RBPMS2 | 348093 | A_23_P100056 | -1.4092 | 0.1411 | |
| SRP064894 | RBPMS2 | 348093 | RNAseq | -1.1664 | 0.0027 | |
| SRP133303 | RBPMS2 | 348093 | RNAseq | -1.0690 | 0.1185 | |
| SRP159526 | RBPMS2 | 348093 | RNAseq | -1.1927 | 0.0745 | |
| SRP219564 | RBPMS2 | 348093 | RNAseq | -0.9206 | 0.3775 | |
| TCGA | RBPMS2 | 348093 | RNAseq | -1.2699 | 0.0000 |
Upregulated datasets: 0; Downregulated datasets: 5.
Survival by RBPMS2 expression:
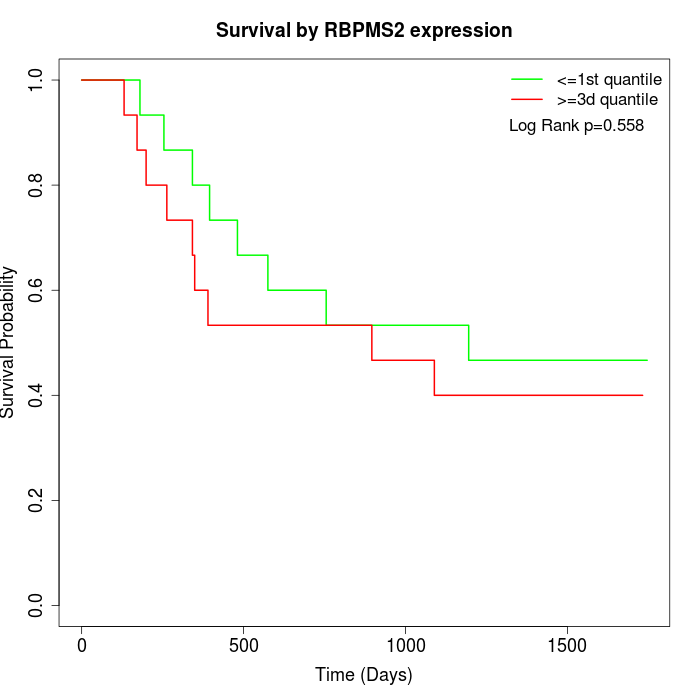 | 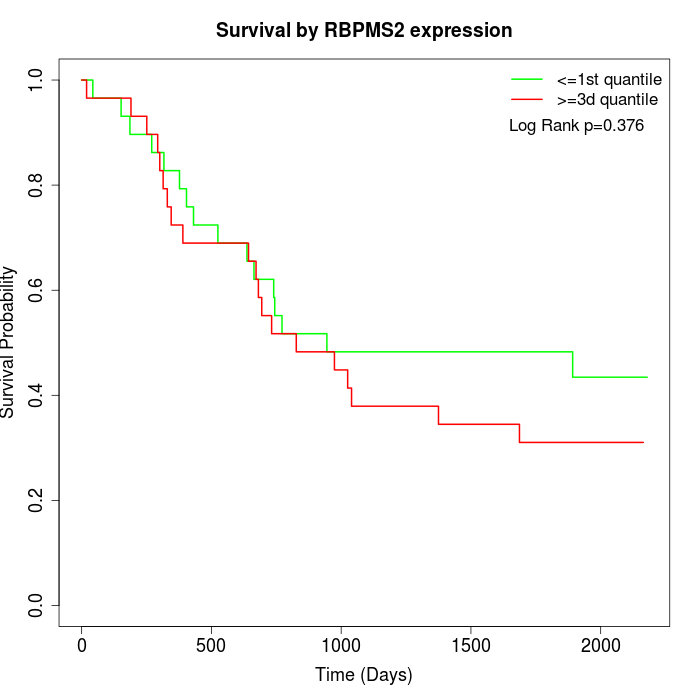 | 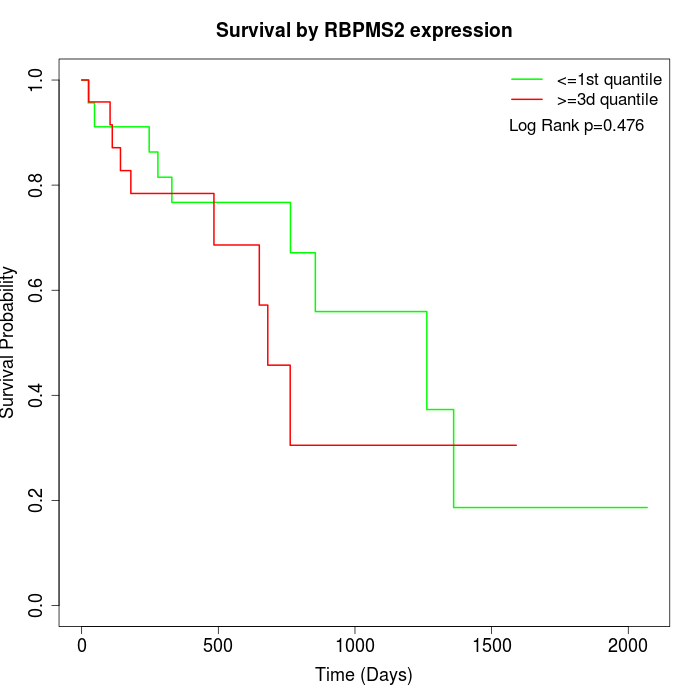 |
| GSE53622 | GSE53624 | TCGA |
Note: Click image to view full size file.
Copy number change of RBPMS2:
| Dataset | Gene | EntrezID | Gain | Loss | Normal | Detail |
|---|---|---|---|---|---|---|
| GSE15526 | RBPMS2 | 348093 | 7 | 4 | 19 | |
| GSE20123 | RBPMS2 | 348093 | 7 | 4 | 19 | |
| GSE43470 | RBPMS2 | 348093 | 4 | 6 | 33 | |
| GSE46452 | RBPMS2 | 348093 | 3 | 7 | 49 | |
| GSE47630 | RBPMS2 | 348093 | 8 | 10 | 22 | |
| GSE54993 | RBPMS2 | 348093 | 5 | 6 | 59 | |
| GSE54994 | RBPMS2 | 348093 | 6 | 7 | 40 | |
| GSE60625 | RBPMS2 | 348093 | 4 | 0 | 7 | |
| GSE74703 | RBPMS2 | 348093 | 4 | 3 | 29 | |
| GSE74704 | RBPMS2 | 348093 | 3 | 4 | 13 | |
| TCGA | RBPMS2 | 348093 | 10 | 16 | 70 |
Total number of gains: 61; Total number of losses: 67; Total Number of normals: 360.
Somatic mutations of RBPMS2:
Generating mutation plots.
Highly correlated genes for RBPMS2:
Showing top 20/1088 corelated genes with mean PCC>0.5.
| Gene1 | Gene2 | Mean PCC | Num. Datasets | Num. PCC<0 | Num. PCC>0.5 |
|---|---|---|---|---|---|
| RBPMS2 | PGM5 | 0.905735 | 6 | 0 | 6 |
| RBPMS2 | LDB3 | 0.895943 | 4 | 0 | 4 |
| RBPMS2 | PDE5A | 0.878584 | 6 | 0 | 6 |
| RBPMS2 | XKR4 | 0.875267 | 5 | 0 | 5 |
| RBPMS2 | DTNA | 0.871129 | 4 | 0 | 4 |
| RBPMS2 | MYOCD | 0.870931 | 6 | 0 | 6 |
| RBPMS2 | CHRDL1 | 0.864051 | 6 | 0 | 6 |
| RBPMS2 | HPSE2 | 0.857693 | 5 | 0 | 5 |
| RBPMS2 | RASL12 | 0.853346 | 7 | 0 | 7 |
| RBPMS2 | CDH19 | 0.849906 | 5 | 0 | 5 |
| RBPMS2 | ASPA | 0.849043 | 5 | 0 | 5 |
| RBPMS2 | BHMT2 | 0.844441 | 6 | 0 | 6 |
| RBPMS2 | LINC01279 | 0.840406 | 3 | 0 | 3 |
| RBPMS2 | PLN | 0.838212 | 8 | 0 | 8 |
| RBPMS2 | SORBS1 | 0.832747 | 6 | 0 | 6 |
| RBPMS2 | CYP21A2 | 0.831437 | 3 | 0 | 3 |
| RBPMS2 | MRVI1 | 0.826426 | 7 | 0 | 7 |
| RBPMS2 | LMOD1 | 0.82347 | 8 | 0 | 7 |
| RBPMS2 | CTNNA3 | 0.822383 | 5 | 0 | 5 |
| RBPMS2 | NEGR1 | 0.820409 | 6 | 0 | 6 |
For details and further investigation, click here