| Full name: activator of basal transcription 1 | Alias Symbol: Esf2 | ||
| Type: protein-coding gene | Cytoband: 6p22.2 | ||
| Entrez ID: 29777 | HGNC ID: HGNC:17369 | Ensembl Gene: ENSG00000146109 | OMIM ID: |
Screen Evidence:
| |||
Expression of ABT1:
| Dataset | Gene | EntrezID | Probe | Log2FC | Adj.pValue | Expression |
|---|---|---|---|---|---|---|
| GSE17351 | ABT1 | 29777 | 218405_at | 0.4726 | 0.3205 | |
| GSE20347 | ABT1 | 29777 | 218405_at | 0.2481 | 0.1187 | |
| GSE23400 | ABT1 | 29777 | 218405_at | 0.1035 | 0.0250 | |
| GSE26886 | ABT1 | 29777 | 218405_at | 0.2220 | 0.3828 | |
| GSE29001 | ABT1 | 29777 | 218405_at | 0.1301 | 0.3387 | |
| GSE38129 | ABT1 | 29777 | 218405_at | 0.3510 | 0.0059 | |
| GSE45670 | ABT1 | 29777 | 218405_at | 0.0747 | 0.5938 | |
| GSE53622 | ABT1 | 29777 | 120105 | -0.2531 | 0.0031 | |
| GSE53624 | ABT1 | 29777 | 120105 | 0.0075 | 0.9514 | |
| GSE63941 | ABT1 | 29777 | 218405_at | 1.3998 | 0.0005 | |
| GSE77861 | ABT1 | 29777 | 218405_at | -0.0492 | 0.8587 | |
| GSE97050 | ABT1 | 29777 | A_23_P30784 | 0.0545 | 0.8626 | |
| SRP007169 | ABT1 | 29777 | RNAseq | -0.3331 | 0.3516 | |
| SRP008496 | ABT1 | 29777 | RNAseq | -0.2147 | 0.3430 | |
| SRP064894 | ABT1 | 29777 | RNAseq | 0.0956 | 0.6494 | |
| SRP133303 | ABT1 | 29777 | RNAseq | 0.0505 | 0.7366 | |
| SRP159526 | ABT1 | 29777 | RNAseq | -0.0964 | 0.6870 | |
| SRP193095 | ABT1 | 29777 | RNAseq | -0.3077 | 0.0070 | |
| SRP219564 | ABT1 | 29777 | RNAseq | 0.0967 | 0.7363 | |
| TCGA | ABT1 | 29777 | RNAseq | 0.1258 | 0.0243 |
Upregulated datasets: 1; Downregulated datasets: 0.
Survival by ABT1 expression:
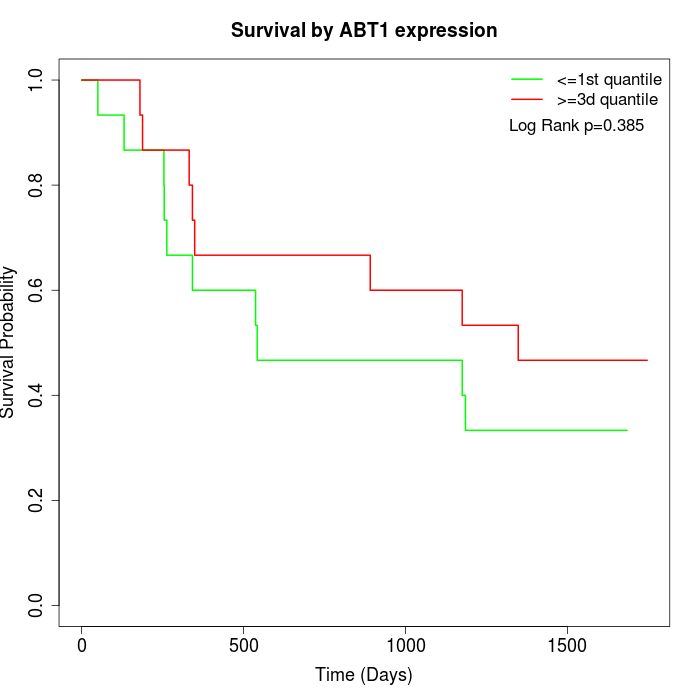 | 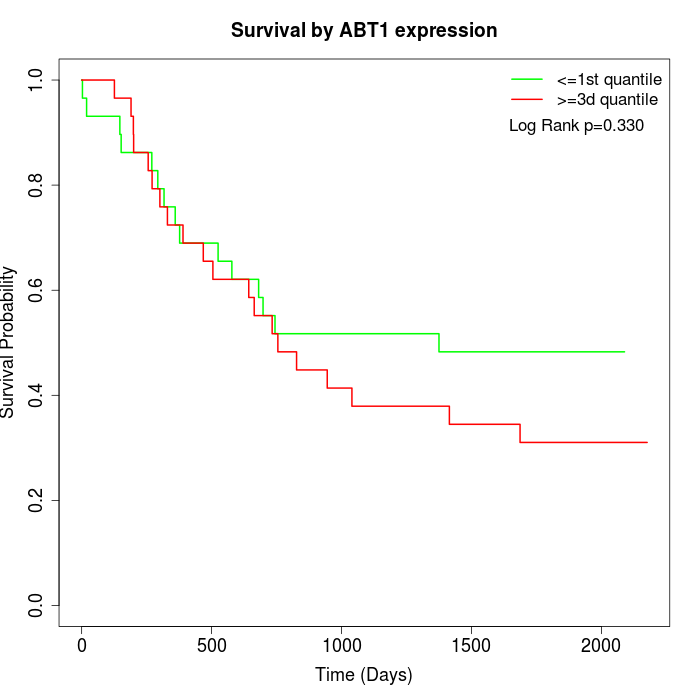 | 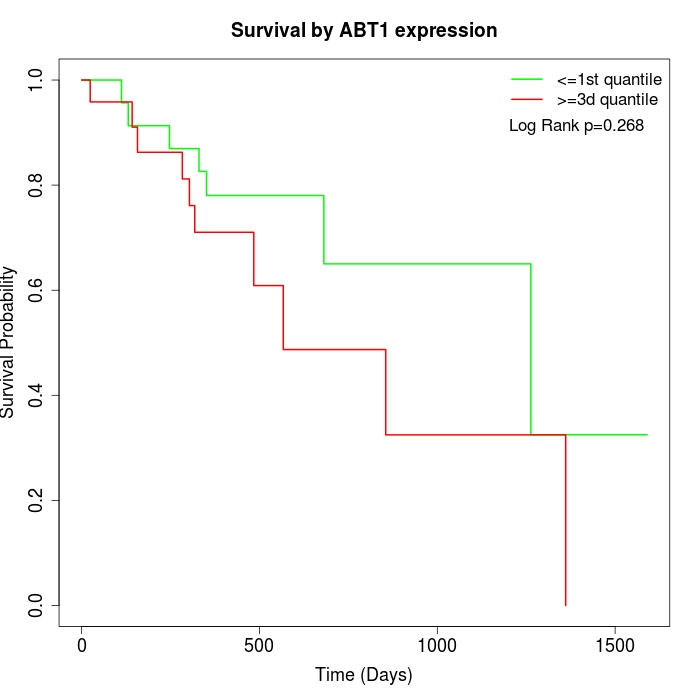 |
| GSE53622 | GSE53624 | TCGA |
Note: Click image to view full size file.
Copy number change of ABT1:
| Dataset | Gene | EntrezID | Gain | Loss | Normal | Detail |
|---|---|---|---|---|---|---|
| GSE15526 | ABT1 | 29777 | 4 | 2 | 24 | |
| GSE20123 | ABT1 | 29777 | 4 | 2 | 24 | |
| GSE43470 | ABT1 | 29777 | 5 | 0 | 38 | |
| GSE46452 | ABT1 | 29777 | 1 | 10 | 48 | |
| GSE47630 | ABT1 | 29777 | 8 | 5 | 27 | |
| GSE54993 | ABT1 | 29777 | 1 | 1 | 68 | |
| GSE54994 | ABT1 | 29777 | 10 | 4 | 39 | |
| GSE60625 | ABT1 | 29777 | 0 | 1 | 10 | |
| GSE74703 | ABT1 | 29777 | 5 | 0 | 31 | |
| GSE74704 | ABT1 | 29777 | 0 | 1 | 19 | |
| TCGA | ABT1 | 29777 | 15 | 21 | 60 |
Total number of gains: 53; Total number of losses: 47; Total Number of normals: 388.
Somatic mutations of ABT1:
Generating mutation plots.
Highly correlated genes for ABT1:
Showing top 20/145 corelated genes with mean PCC>0.5.
| Gene1 | Gene2 | Mean PCC | Num. Datasets | Num. PCC<0 | Num. PCC>0.5 |
|---|---|---|---|---|---|
| ABT1 | AIFM3 | 0.785732 | 3 | 0 | 3 |
| ABT1 | TMEM102 | 0.760161 | 3 | 0 | 3 |
| ABT1 | SNORA71A | 0.747417 | 3 | 0 | 3 |
| ABT1 | ZNF687 | 0.70261 | 3 | 0 | 3 |
| ABT1 | WDR83 | 0.688457 | 4 | 0 | 3 |
| ABT1 | BEND3 | 0.68681 | 3 | 0 | 3 |
| ABT1 | CDCA5 | 0.686522 | 3 | 0 | 3 |
| ABT1 | SMG7 | 0.681529 | 4 | 0 | 4 |
| ABT1 | GTF2IRD2 | 0.678841 | 3 | 0 | 3 |
| ABT1 | RANBP3 | 0.676978 | 3 | 0 | 3 |
| ABT1 | MIIP | 0.67316 | 4 | 0 | 3 |
| ABT1 | APTX | 0.670912 | 5 | 0 | 4 |
| ABT1 | ARMC7 | 0.666045 | 4 | 0 | 3 |
| ABT1 | PYGO2 | 0.664839 | 3 | 0 | 3 |
| ABT1 | ALKBH2 | 0.664327 | 4 | 0 | 3 |
| ABT1 | TFB2M | 0.662243 | 5 | 0 | 4 |
| ABT1 | NUP62CL | 0.649123 | 5 | 0 | 4 |
| ABT1 | PRPF19 | 0.647353 | 5 | 0 | 4 |
| ABT1 | PCP2 | 0.644147 | 3 | 0 | 3 |
| ABT1 | HIRIP3 | 0.644088 | 4 | 0 | 4 |
For details and further investigation, click here