| Full name: transcription factor B2, mitochondrial | Alias Symbol: FLJ23182|FLJ22661|Hkp1 | ||
| Type: protein-coding gene | Cytoband: 1q44 | ||
| Entrez ID: 64216 | HGNC ID: HGNC:18559 | Ensembl Gene: ENSG00000162851 | OMIM ID: 607055 |
Screen Evidence:
| |||
Expression of TFB2M:
| Dataset | Gene | EntrezID | Probe | Log2FC | Adj.pValue | Expression |
|---|---|---|---|---|---|---|
| GSE17351 | TFB2M | 64216 | 218605_at | 0.9842 | 0.0584 | |
| GSE20347 | TFB2M | 64216 | 218605_at | 0.8381 | 0.0001 | |
| GSE23400 | TFB2M | 64216 | 218605_at | 0.5833 | 0.0000 | |
| GSE26886 | TFB2M | 64216 | 218605_at | 0.8245 | 0.0010 | |
| GSE29001 | TFB2M | 64216 | 218605_at | 0.8453 | 0.0925 | |
| GSE38129 | TFB2M | 64216 | 218605_at | 0.9071 | 0.0000 | |
| GSE45670 | TFB2M | 64216 | 218605_at | 0.4370 | 0.0117 | |
| GSE53622 | TFB2M | 64216 | 41431 | 0.3424 | 0.0000 | |
| GSE53624 | TFB2M | 64216 | 41431 | 0.6479 | 0.0000 | |
| GSE63941 | TFB2M | 64216 | 218605_at | 0.4779 | 0.1086 | |
| GSE77861 | TFB2M | 64216 | 218605_at | 0.7029 | 0.0174 | |
| GSE97050 | TFB2M | 64216 | A_23_P45940 | 0.1818 | 0.6212 | |
| SRP007169 | TFB2M | 64216 | RNAseq | 0.3249 | 0.4292 | |
| SRP008496 | TFB2M | 64216 | RNAseq | 0.6375 | 0.0379 | |
| SRP064894 | TFB2M | 64216 | RNAseq | 0.2470 | 0.0711 | |
| SRP133303 | TFB2M | 64216 | RNAseq | 0.6264 | 0.0000 | |
| SRP159526 | TFB2M | 64216 | RNAseq | 0.8765 | 0.0404 | |
| SRP193095 | TFB2M | 64216 | RNAseq | 0.3146 | 0.0215 | |
| SRP219564 | TFB2M | 64216 | RNAseq | 0.4439 | 0.2692 | |
| TCGA | TFB2M | 64216 | RNAseq | 0.1604 | 0.0166 |
Upregulated datasets: 0; Downregulated datasets: 0.
Survival by TFB2M expression:
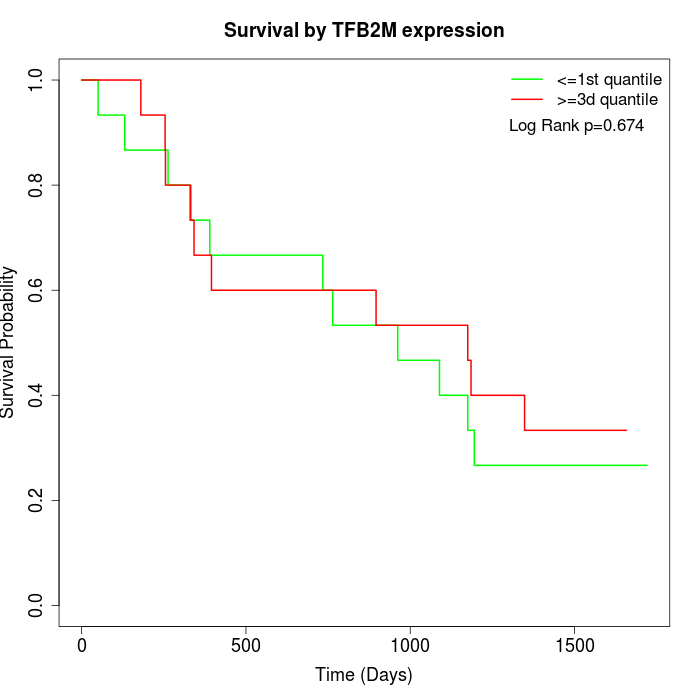 | 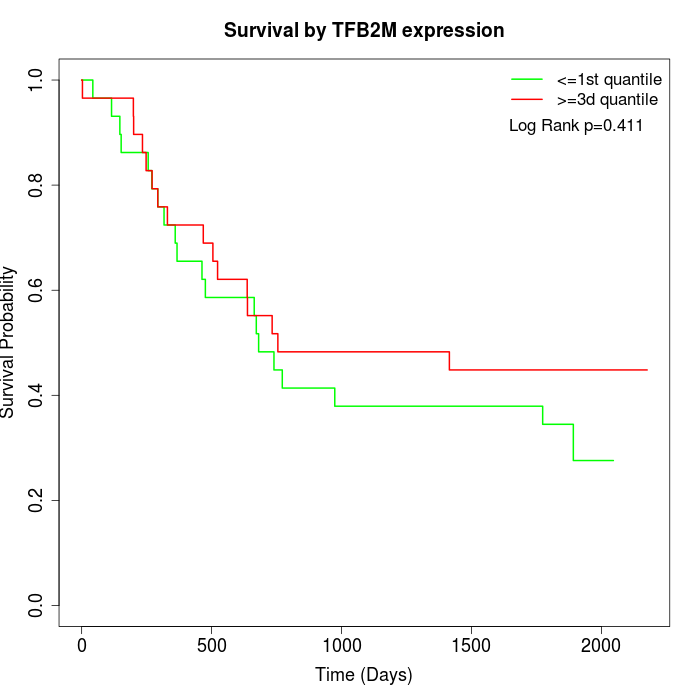 | 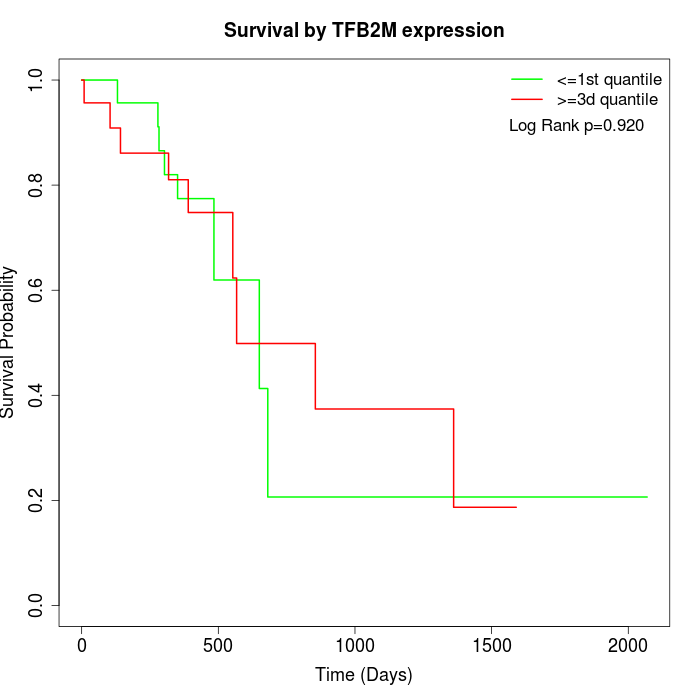 |
| GSE53622 | GSE53624 | TCGA |
Note: Click image to view full size file.
Copy number change of TFB2M:
| Dataset | Gene | EntrezID | Gain | Loss | Normal | Detail |
|---|---|---|---|---|---|---|
| GSE15526 | TFB2M | 64216 | 7 | 1 | 22 | |
| GSE20123 | TFB2M | 64216 | 7 | 1 | 22 | |
| GSE43470 | TFB2M | 64216 | 5 | 3 | 35 | |
| GSE46452 | TFB2M | 64216 | 4 | 2 | 53 | |
| GSE47630 | TFB2M | 64216 | 15 | 1 | 24 | |
| GSE54993 | TFB2M | 64216 | 0 | 6 | 64 | |
| GSE54994 | TFB2M | 64216 | 18 | 0 | 35 | |
| GSE60625 | TFB2M | 64216 | 0 | 0 | 11 | |
| GSE74703 | TFB2M | 64216 | 5 | 1 | 30 | |
| GSE74704 | TFB2M | 64216 | 2 | 0 | 18 | |
| TCGA | TFB2M | 64216 | 46 | 5 | 45 |
Total number of gains: 109; Total number of losses: 20; Total Number of normals: 359.
Somatic mutations of TFB2M:
Generating mutation plots.
Highly correlated genes for TFB2M:
Showing top 20/1463 corelated genes with mean PCC>0.5.
| Gene1 | Gene2 | Mean PCC | Num. Datasets | Num. PCC<0 | Num. PCC>0.5 |
|---|---|---|---|---|---|
| TFB2M | DESI2 | 0.773382 | 10 | 0 | 10 |
| TFB2M | CKS1B | 0.720221 | 12 | 0 | 12 |
| TFB2M | SNRPE | 0.72 | 13 | 0 | 11 |
| TFB2M | MTERF3 | 0.719548 | 8 | 0 | 8 |
| TFB2M | HEATR1 | 0.717516 | 12 | 0 | 11 |
| TFB2M | DYRK2 | 0.700949 | 4 | 0 | 4 |
| TFB2M | RRP15 | 0.700126 | 13 | 0 | 11 |
| TFB2M | RUVBL1 | 0.6924 | 13 | 0 | 12 |
| TFB2M | ILF2 | 0.691526 | 12 | 0 | 10 |
| TFB2M | TIMM17A | 0.688305 | 11 | 0 | 10 |
| TFB2M | RAD21 | 0.68273 | 8 | 0 | 8 |
| TFB2M | MRS2 | 0.682054 | 7 | 0 | 7 |
| TFB2M | TOR3A | 0.681351 | 11 | 0 | 10 |
| TFB2M | C1orf112 | 0.679831 | 8 | 0 | 8 |
| TFB2M | ZNF670 | 0.675954 | 7 | 0 | 7 |
| TFB2M | PRKDC | 0.67584 | 11 | 0 | 9 |
| TFB2M | KLHL8 | 0.675823 | 3 | 0 | 3 |
| TFB2M | PARP1 | 0.674777 | 12 | 0 | 10 |
| TFB2M | C1orf131 | 0.674732 | 8 | 0 | 7 |
| TFB2M | COG2 | 0.673493 | 11 | 0 | 10 |
For details and further investigation, click here