| Full name: apoptosis inducing factor mitochondria associated 3 | Alias Symbol: AIFL|FLJ30473 | ||
| Type: protein-coding gene | Cytoband: 22q11.21 | ||
| Entrez ID: 150209 | HGNC ID: HGNC:26398 | Ensembl Gene: ENSG00000183773 | OMIM ID: 617298 |
Expression of AIFM3:
| Dataset | Gene | EntrezID | Probe | Log2FC | Adj.pValue | Expression |
|---|---|---|---|---|---|---|
| GSE17351 | AIFM3 | 150209 | 244084_at | 0.2353 | 0.5426 | |
| GSE26886 | AIFM3 | 150209 | 244084_at | 0.3575 | 0.0036 | |
| GSE45670 | AIFM3 | 150209 | 244084_at | 0.3399 | 0.3219 | |
| GSE53622 | AIFM3 | 150209 | 1226 | 0.4257 | 0.0000 | |
| GSE53624 | AIFM3 | 150209 | 54465 | 0.7365 | 0.0000 | |
| GSE63941 | AIFM3 | 150209 | 244084_at | 0.2747 | 0.2512 | |
| GSE77861 | AIFM3 | 150209 | 244084_at | 0.1716 | 0.2337 | |
| GSE97050 | AIFM3 | 150209 | A_23_P258194 | 0.2472 | 0.3621 | |
| SRP064894 | AIFM3 | 150209 | RNAseq | 2.1916 | 0.0000 | |
| SRP133303 | AIFM3 | 150209 | RNAseq | 0.6441 | 0.0830 | |
| SRP159526 | AIFM3 | 150209 | RNAseq | 1.3691 | 0.0048 | |
| SRP219564 | AIFM3 | 150209 | RNAseq | 1.6897 | 0.0000 | |
| TCGA | AIFM3 | 150209 | RNAseq | 1.4702 | 0.0000 |
Upregulated datasets: 4; Downregulated datasets: 0.
Survival by AIFM3 expression:
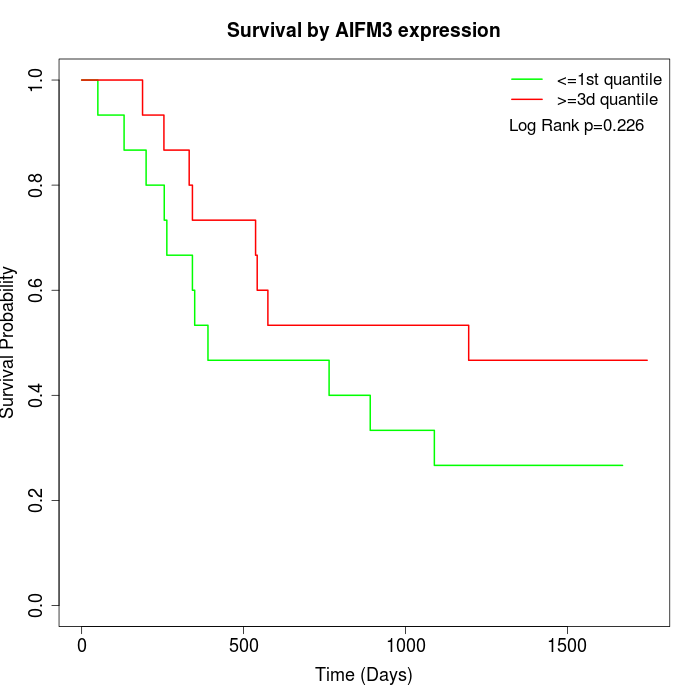 | 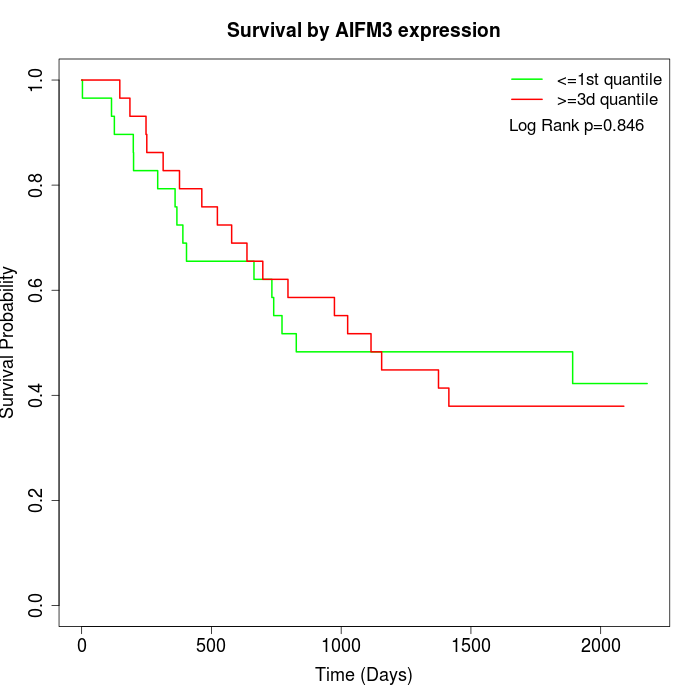 |  |
| GSE53622 | GSE53624 | TCGA |
Note: Click image to view full size file.
Copy number change of AIFM3:
| Dataset | Gene | EntrezID | Gain | Loss | Normal | Detail |
|---|---|---|---|---|---|---|
| GSE15526 | AIFM3 | 150209 | 6 | 7 | 17 | |
| GSE20123 | AIFM3 | 150209 | 6 | 7 | 17 | |
| GSE43470 | AIFM3 | 150209 | 3 | 7 | 33 | |
| GSE46452 | AIFM3 | 150209 | 33 | 1 | 25 | |
| GSE47630 | AIFM3 | 150209 | 8 | 5 | 27 | |
| GSE54993 | AIFM3 | 150209 | 3 | 6 | 61 | |
| GSE54994 | AIFM3 | 150209 | 11 | 7 | 35 | |
| GSE60625 | AIFM3 | 150209 | 5 | 0 | 6 | |
| GSE74703 | AIFM3 | 150209 | 3 | 5 | 28 | |
| GSE74704 | AIFM3 | 150209 | 3 | 4 | 13 | |
| TCGA | AIFM3 | 150209 | 27 | 17 | 52 |
Total number of gains: 108; Total number of losses: 66; Total Number of normals: 314.
Somatic mutations of AIFM3:
Generating mutation plots.
Highly correlated genes for AIFM3:
Showing top 20/162 corelated genes with mean PCC>0.5.
| Gene1 | Gene2 | Mean PCC | Num. Datasets | Num. PCC<0 | Num. PCC>0.5 |
|---|---|---|---|---|---|
| AIFM3 | ABT1 | 0.785732 | 3 | 0 | 3 |
| AIFM3 | LAMTOR2 | 0.752097 | 3 | 0 | 3 |
| AIFM3 | C11orf65 | 0.725935 | 3 | 0 | 3 |
| AIFM3 | TOR2A | 0.719218 | 4 | 0 | 3 |
| AIFM3 | ATXN7L2 | 0.716396 | 3 | 0 | 3 |
| AIFM3 | PCSK1N | 0.715792 | 4 | 0 | 4 |
| AIFM3 | OR10C1 | 0.7108 | 3 | 0 | 3 |
| AIFM3 | PMEPA1 | 0.710156 | 3 | 0 | 3 |
| AIFM3 | FOXJ1 | 0.70363 | 3 | 0 | 3 |
| AIFM3 | C2orf81 | 0.701949 | 3 | 0 | 3 |
| AIFM3 | TCTE1 | 0.701411 | 3 | 0 | 3 |
| AIFM3 | EFNB1 | 0.696277 | 4 | 0 | 3 |
| AIFM3 | TKTL1 | 0.692249 | 4 | 0 | 3 |
| AIFM3 | PRR7 | 0.686693 | 4 | 0 | 3 |
| AIFM3 | TMEM52 | 0.683842 | 4 | 0 | 3 |
| AIFM3 | FOXE3 | 0.683463 | 3 | 0 | 3 |
| AIFM3 | GPRIN1 | 0.681212 | 4 | 0 | 3 |
| AIFM3 | NRIP3 | 0.675054 | 3 | 0 | 3 |
| AIFM3 | UFSP1 | 0.674667 | 4 | 0 | 3 |
| AIFM3 | POLD1 | 0.671172 | 4 | 0 | 3 |
For details and further investigation, click here