| Full name: pygopus family PHD finger 2 | Alias Symbol: | ||
| Type: protein-coding gene | Cytoband: 1q21.3 | ||
| Entrez ID: 90780 | HGNC ID: HGNC:30257 | Ensembl Gene: ENSG00000163348 | OMIM ID: 606903 |
Expression of PYGO2:
| Dataset | Gene | EntrezID | Probe | Log2FC | Adj.pValue | Expression |
|---|---|---|---|---|---|---|
| GSE17351 | PYGO2 | 90780 | 225370_at | 0.5481 | 0.0946 | |
| GSE26886 | PYGO2 | 90780 | 225370_at | 0.0973 | 0.3268 | |
| GSE45670 | PYGO2 | 90780 | 225370_at | 0.1306 | 0.0641 | |
| GSE53622 | PYGO2 | 90780 | 116328 | 0.3400 | 0.0000 | |
| GSE53624 | PYGO2 | 90780 | 100386 | -2.0149 | 0.0000 | |
| GSE63941 | PYGO2 | 90780 | 225370_at | 1.2495 | 0.0002 | |
| GSE77861 | PYGO2 | 90780 | 225370_at | 0.2955 | 0.0401 | |
| GSE97050 | PYGO2 | 90780 | A_23_P411953 | 0.1245 | 0.6907 | |
| SRP007169 | PYGO2 | 90780 | RNAseq | 0.0590 | 0.8626 | |
| SRP008496 | PYGO2 | 90780 | RNAseq | 0.2650 | 0.2452 | |
| SRP064894 | PYGO2 | 90780 | RNAseq | 0.4511 | 0.0110 | |
| SRP133303 | PYGO2 | 90780 | RNAseq | 0.1130 | 0.4721 | |
| SRP159526 | PYGO2 | 90780 | RNAseq | 0.7175 | 0.0028 | |
| SRP193095 | PYGO2 | 90780 | RNAseq | 0.1941 | 0.0408 | |
| SRP219564 | PYGO2 | 90780 | RNAseq | 0.4948 | 0.2160 | |
| TCGA | PYGO2 | 90780 | RNAseq | 0.0977 | 0.0401 |
Upregulated datasets: 1; Downregulated datasets: 1.
Survival by PYGO2 expression:
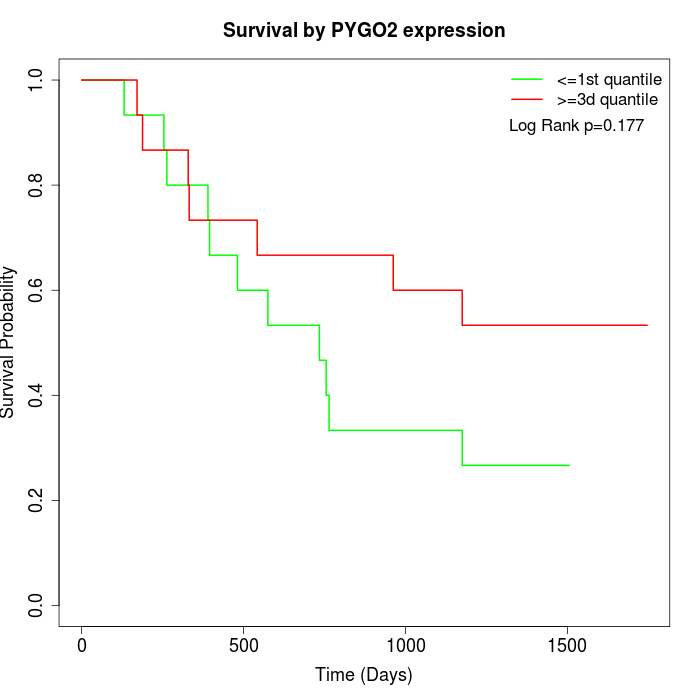 | 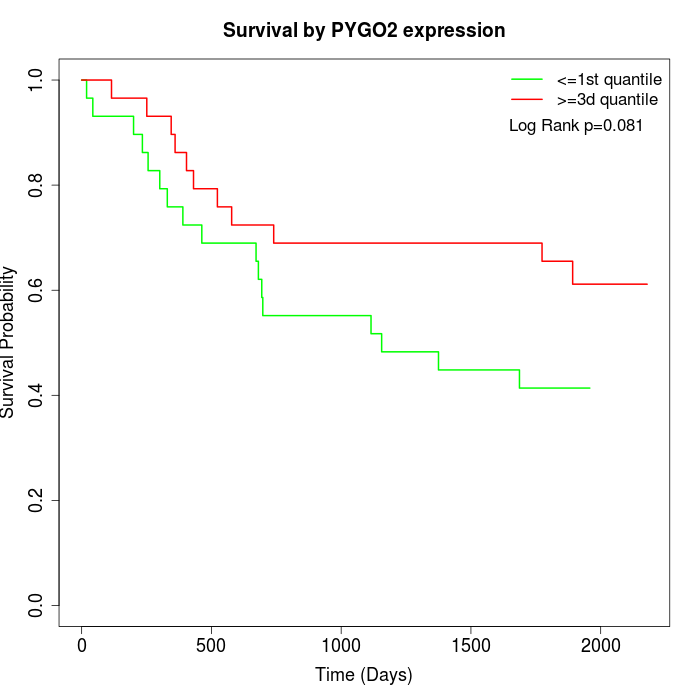 | 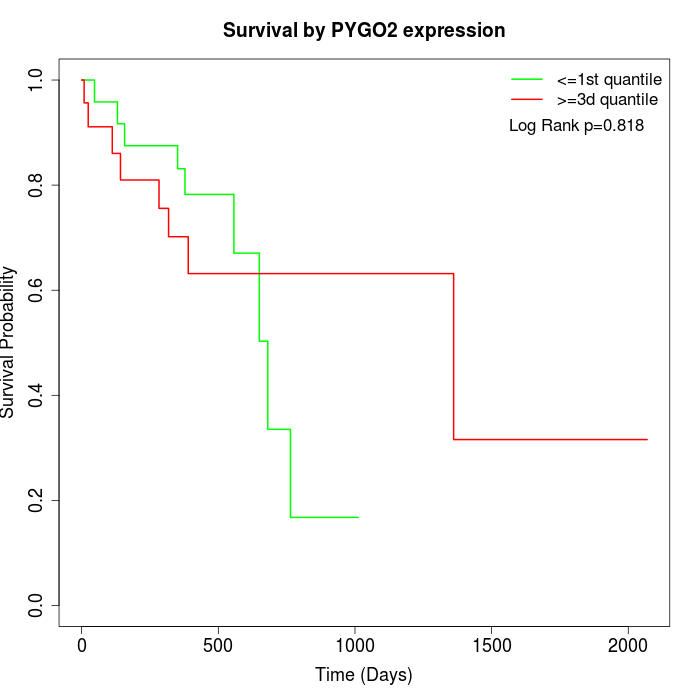 |
| GSE53622 | GSE53624 | TCGA |
Note: Click image to view full size file.
Copy number change of PYGO2:
| Dataset | Gene | EntrezID | Gain | Loss | Normal | Detail |
|---|---|---|---|---|---|---|
| GSE15526 | PYGO2 | 90780 | 14 | 0 | 16 | |
| GSE20123 | PYGO2 | 90780 | 13 | 0 | 17 | |
| GSE43470 | PYGO2 | 90780 | 6 | 2 | 35 | |
| GSE46452 | PYGO2 | 90780 | 2 | 1 | 56 | |
| GSE47630 | PYGO2 | 90780 | 14 | 0 | 26 | |
| GSE54993 | PYGO2 | 90780 | 0 | 4 | 66 | |
| GSE54994 | PYGO2 | 90780 | 16 | 0 | 37 | |
| GSE60625 | PYGO2 | 90780 | 0 | 0 | 11 | |
| GSE74703 | PYGO2 | 90780 | 6 | 1 | 29 | |
| GSE74704 | PYGO2 | 90780 | 6 | 0 | 14 | |
| TCGA | PYGO2 | 90780 | 38 | 2 | 56 |
Total number of gains: 115; Total number of losses: 10; Total Number of normals: 363.
Somatic mutations of PYGO2:
Generating mutation plots.
Highly correlated genes for PYGO2:
Showing top 20/155 corelated genes with mean PCC>0.5.
| Gene1 | Gene2 | Mean PCC | Num. Datasets | Num. PCC<0 | Num. PCC>0.5 |
|---|---|---|---|---|---|
| PYGO2 | GGT7 | 0.784156 | 3 | 0 | 3 |
| PYGO2 | C19orf53 | 0.771818 | 3 | 0 | 3 |
| PYGO2 | TAF5L | 0.770052 | 4 | 0 | 4 |
| PYGO2 | PFN1 | 0.758333 | 3 | 0 | 3 |
| PYGO2 | SNORA71A | 0.754047 | 3 | 0 | 3 |
| PYGO2 | STK11 | 0.752099 | 3 | 0 | 3 |
| PYGO2 | LIPE | 0.726183 | 3 | 0 | 3 |
| PYGO2 | CCDC130 | 0.725017 | 3 | 0 | 3 |
| PYGO2 | ZBTB48 | 0.723439 | 4 | 0 | 4 |
| PYGO2 | COPS7B | 0.708309 | 3 | 0 | 3 |
| PYGO2 | BMP7 | 0.695654 | 3 | 0 | 3 |
| PYGO2 | TRIM31 | 0.694242 | 3 | 0 | 3 |
| PYGO2 | CCDC114 | 0.693081 | 3 | 0 | 3 |
| PYGO2 | ABHD11 | 0.683083 | 4 | 0 | 4 |
| PYGO2 | EPHA10 | 0.675505 | 3 | 0 | 3 |
| PYGO2 | SLC27A1 | 0.674864 | 3 | 0 | 3 |
| PYGO2 | PRR15 | 0.674836 | 4 | 0 | 4 |
| PYGO2 | RNF126 | 0.670113 | 3 | 0 | 3 |
| PYGO2 | UBE2S | 0.667529 | 4 | 0 | 4 |
| PYGO2 | ABT1 | 0.664839 | 3 | 0 | 3 |
For details and further investigation, click here