| Full name: actin like 8 | Alias Symbol: CT57 | ||
| Type: protein-coding gene | Cytoband: 1p36.13 | ||
| Entrez ID: 81569 | HGNC ID: HGNC:24018 | Ensembl Gene: ENSG00000117148 | OMIM ID: |
Expression of ACTL8:
| Dataset | Gene | EntrezID | Probe | Log2FC | Adj.pValue | Expression |
|---|---|---|---|---|---|---|
| GSE17351 | ACTL8 | 81569 | 214957_at | 0.3681 | 0.4030 | |
| GSE20347 | ACTL8 | 81569 | 214957_at | 0.0391 | 0.7660 | |
| GSE23400 | ACTL8 | 81569 | 214957_at | -0.0687 | 0.2978 | |
| GSE26886 | ACTL8 | 81569 | 214957_at | 0.2101 | 0.2265 | |
| GSE29001 | ACTL8 | 81569 | 214957_at | -0.0116 | 0.9648 | |
| GSE38129 | ACTL8 | 81569 | 214957_at | -0.0771 | 0.5089 | |
| GSE45670 | ACTL8 | 81569 | 214957_at | 0.2003 | 0.2568 | |
| GSE53622 | ACTL8 | 81569 | 119716 | -0.0139 | 0.8612 | |
| GSE53624 | ACTL8 | 81569 | 119716 | -0.1332 | 0.2267 | |
| GSE63941 | ACTL8 | 81569 | 214957_at | 0.4795 | 0.3244 | |
| GSE77861 | ACTL8 | 81569 | 214957_at | -0.1918 | 0.0647 | |
| GSE97050 | ACTL8 | 81569 | A_33_P3288659 | -0.3852 | 0.1726 | |
| TCGA | ACTL8 | 81569 | RNAseq | 3.7600 | 0.0000 |
Upregulated datasets: 1; Downregulated datasets: 0.
Survival by ACTL8 expression:
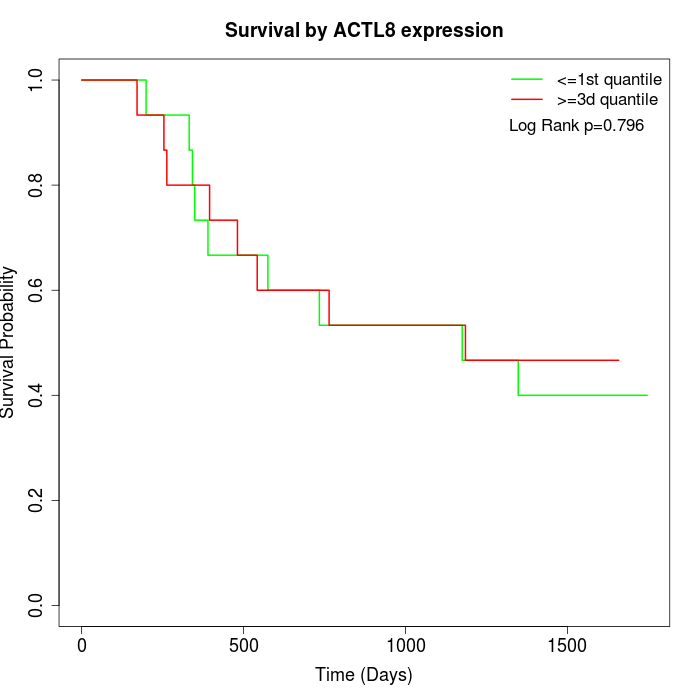 | 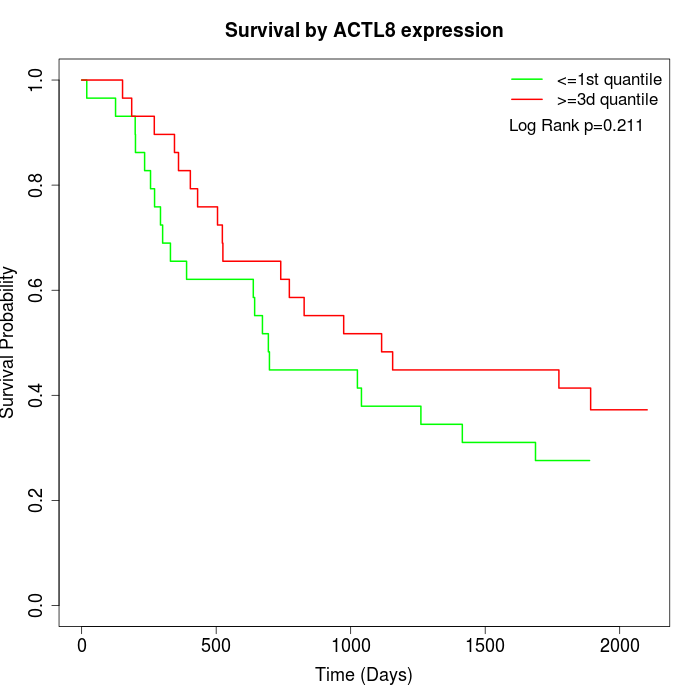 | 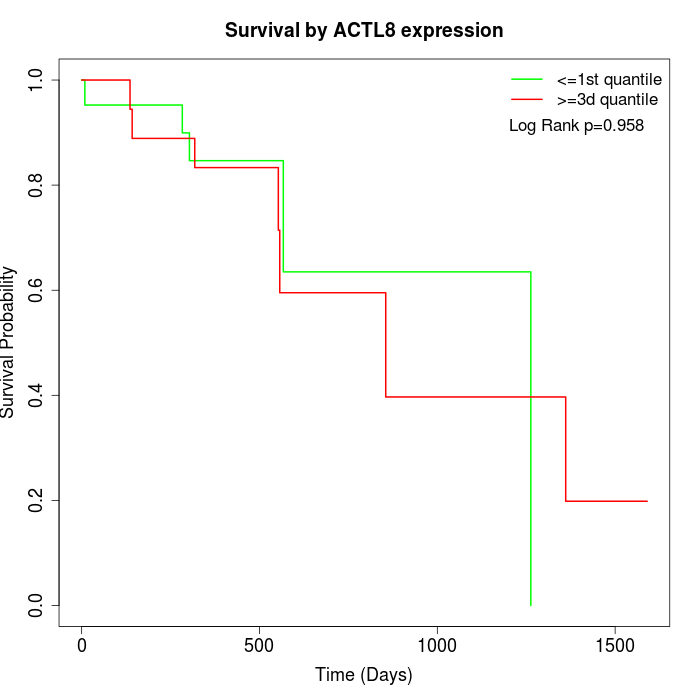 |
| GSE53622 | GSE53624 | TCGA |
Note: Click image to view full size file.
Copy number change of ACTL8:
| Dataset | Gene | EntrezID | Gain | Loss | Normal | Detail |
|---|---|---|---|---|---|---|
| GSE15526 | ACTL8 | 81569 | 0 | 5 | 25 | |
| GSE20123 | ACTL8 | 81569 | 0 | 4 | 26 | |
| GSE43470 | ACTL8 | 81569 | 0 | 8 | 35 | |
| GSE46452 | ACTL8 | 81569 | 5 | 1 | 53 | |
| GSE47630 | ACTL8 | 81569 | 8 | 3 | 29 | |
| GSE54993 | ACTL8 | 81569 | 3 | 1 | 66 | |
| GSE54994 | ACTL8 | 81569 | 10 | 4 | 39 | |
| GSE60625 | ACTL8 | 81569 | 0 | 0 | 11 | |
| GSE74703 | ACTL8 | 81569 | 0 | 5 | 31 | |
| GSE74704 | ACTL8 | 81569 | 0 | 0 | 20 | |
| TCGA | ACTL8 | 81569 | 10 | 22 | 64 |
Total number of gains: 36; Total number of losses: 53; Total Number of normals: 399.
Somatic mutations of ACTL8:
Generating mutation plots.
Highly correlated genes for ACTL8:
Showing top 20/269 corelated genes with mean PCC>0.5.
| Gene1 | Gene2 | Mean PCC | Num. Datasets | Num. PCC<0 | Num. PCC>0.5 |
|---|---|---|---|---|---|
| ACTL8 | CDX2 | 0.700207 | 5 | 0 | 4 |
| ACTL8 | OTOG | 0.694645 | 3 | 0 | 3 |
| ACTL8 | GPATCH3 | 0.693906 | 4 | 0 | 3 |
| ACTL8 | GRIPAP1 | 0.683256 | 3 | 0 | 3 |
| ACTL8 | CUZD1 | 0.680038 | 3 | 0 | 3 |
| ACTL8 | TPO | 0.676858 | 3 | 0 | 3 |
| ACTL8 | YY2 | 0.676819 | 3 | 0 | 3 |
| ACTL8 | LAT | 0.67385 | 4 | 0 | 3 |
| ACTL8 | LAMTOR2 | 0.672321 | 3 | 0 | 3 |
| ACTL8 | MAGEB2 | 0.671754 | 3 | 0 | 3 |
| ACTL8 | MNX1-AS1 | 0.669076 | 3 | 0 | 3 |
| ACTL8 | OR10AD1 | 0.667991 | 3 | 0 | 3 |
| ACTL8 | PRSS38 | 0.667058 | 3 | 0 | 3 |
| ACTL8 | NOBOX | 0.664456 | 4 | 0 | 3 |
| ACTL8 | TXNDC2 | 0.662505 | 3 | 0 | 3 |
| ACTL8 | PAX2 | 0.659442 | 6 | 0 | 5 |
| ACTL8 | FBF1 | 0.658323 | 3 | 0 | 3 |
| ACTL8 | DCDC2 | 0.657718 | 3 | 0 | 3 |
| ACTL8 | HEPACAM2 | 0.6577 | 3 | 0 | 3 |
| ACTL8 | SIM1 | 0.655329 | 5 | 0 | 5 |
For details and further investigation, click here