| Full name: UDP-GlcNAc:betaGal beta-1,3-N-acetylglucosaminyltransferase like 1 | Alias Symbol: B3GNT8 | ||
| Type: protein-coding gene | Cytoband: 17q25.3 | ||
| Entrez ID: 146712 | HGNC ID: HGNC:21727 | Ensembl Gene: ENSG00000175711 | OMIM ID: 615337 |
Expression of B3GNTL1:
| Dataset | Gene | EntrezID | Probe | Log2FC | Adj.pValue | Expression |
|---|---|---|---|---|---|---|
| GSE17351 | B3GNTL1 | 146712 | 213589_s_at | 0.2970 | 0.5431 | |
| GSE20347 | B3GNTL1 | 146712 | 215055_at | -0.0769 | 0.3216 | |
| GSE23400 | B3GNTL1 | 146712 | 215055_at | -0.0834 | 0.0074 | |
| GSE26886 | B3GNTL1 | 146712 | 215055_at | -0.0092 | 0.9624 | |
| GSE29001 | B3GNTL1 | 146712 | 213589_s_at | 0.1812 | 0.3816 | |
| GSE38129 | B3GNTL1 | 146712 | 213589_s_at | 0.1803 | 0.1283 | |
| GSE45670 | B3GNTL1 | 146712 | 215055_at | -0.0206 | 0.8651 | |
| GSE53622 | B3GNTL1 | 146712 | 98427 | 0.3270 | 0.0004 | |
| GSE53624 | B3GNTL1 | 146712 | 98427 | 0.4067 | 0.0000 | |
| GSE63941 | B3GNTL1 | 146712 | 213589_s_at | 0.0160 | 0.9778 | |
| GSE77861 | B3GNTL1 | 146712 | 215055_at | -0.0892 | 0.3913 | |
| GSE97050 | B3GNTL1 | 146712 | A_24_P181672 | 0.5400 | 0.1666 | |
| SRP007169 | B3GNTL1 | 146712 | RNAseq | 0.3577 | 0.5966 | |
| SRP064894 | B3GNTL1 | 146712 | RNAseq | 0.9570 | 0.0010 | |
| SRP133303 | B3GNTL1 | 146712 | RNAseq | 0.1320 | 0.3716 | |
| SRP159526 | B3GNTL1 | 146712 | RNAseq | 0.3215 | 0.2433 | |
| SRP193095 | B3GNTL1 | 146712 | RNAseq | 0.2804 | 0.0897 | |
| SRP219564 | B3GNTL1 | 146712 | RNAseq | 1.0910 | 0.0517 | |
| TCGA | B3GNTL1 | 146712 | RNAseq | 0.3705 | 0.0026 |
Upregulated datasets: 0; Downregulated datasets: 0.
Survival by B3GNTL1 expression:
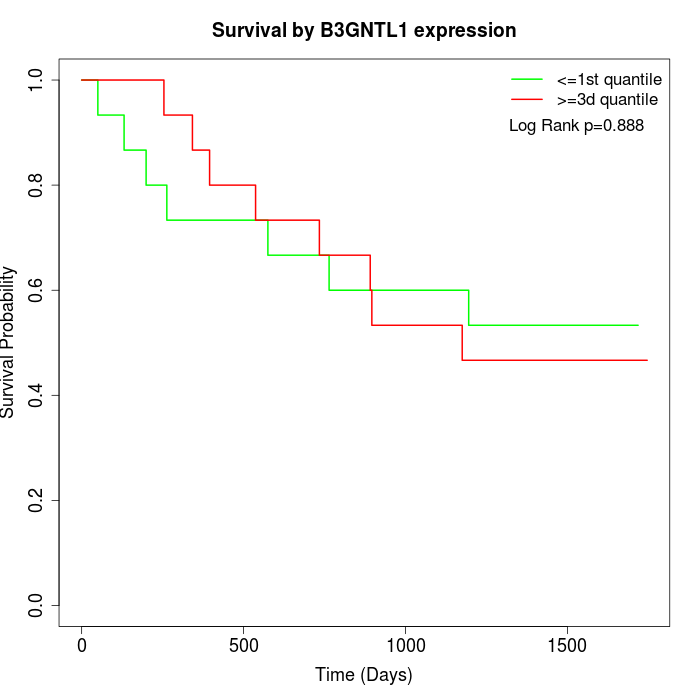 | 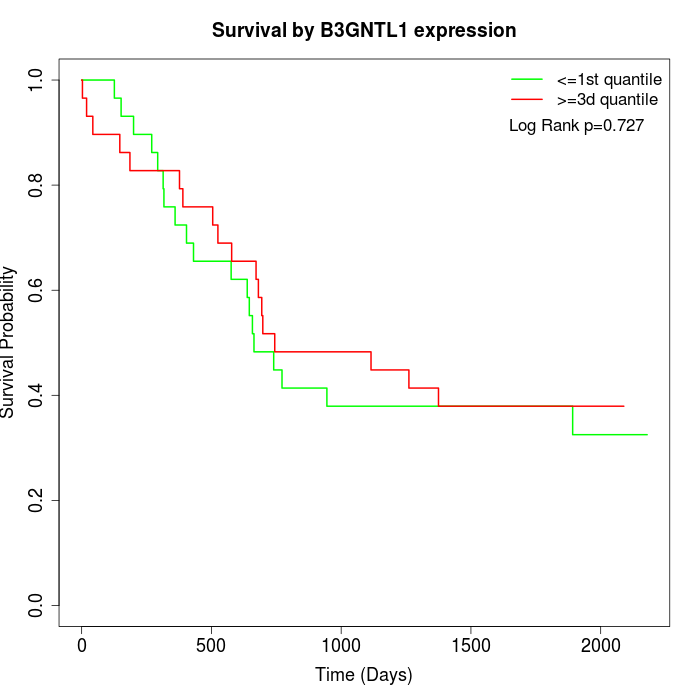 | 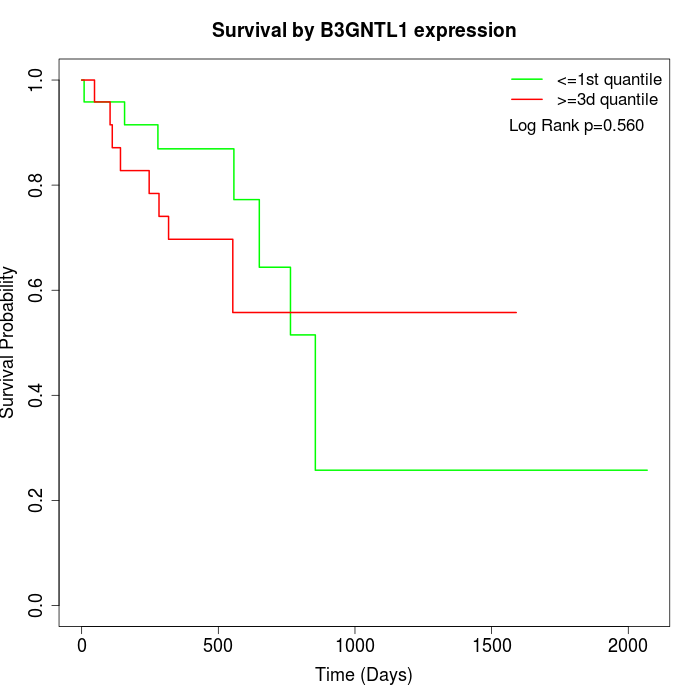 |
| GSE53622 | GSE53624 | TCGA |
Note: Click image to view full size file.
Copy number change of B3GNTL1:
| Dataset | Gene | EntrezID | Gain | Loss | Normal | Detail |
|---|---|---|---|---|---|---|
| GSE15526 | B3GNTL1 | 146712 | 4 | 5 | 21 | |
| GSE20123 | B3GNTL1 | 146712 | 4 | 5 | 21 | |
| GSE43470 | B3GNTL1 | 146712 | 3 | 5 | 35 | |
| GSE46452 | B3GNTL1 | 146712 | 34 | 0 | 25 | |
| GSE47630 | B3GNTL1 | 146712 | 9 | 2 | 29 | |
| GSE54993 | B3GNTL1 | 146712 | 2 | 5 | 63 | |
| GSE54994 | B3GNTL1 | 146712 | 10 | 6 | 37 | |
| GSE60625 | B3GNTL1 | 146712 | 6 | 0 | 5 | |
| GSE74703 | B3GNTL1 | 146712 | 3 | 3 | 30 | |
| GSE74704 | B3GNTL1 | 146712 | 4 | 4 | 12 | |
| TCGA | B3GNTL1 | 146712 | 24 | 14 | 58 |
Total number of gains: 103; Total number of losses: 49; Total Number of normals: 336.
Somatic mutations of B3GNTL1:
Generating mutation plots.
Highly correlated genes for B3GNTL1:
Showing top 20/92 corelated genes with mean PCC>0.5.
| Gene1 | Gene2 | Mean PCC | Num. Datasets | Num. PCC<0 | Num. PCC>0.5 |
|---|---|---|---|---|---|
| B3GNTL1 | CLECL1 | 0.77531 | 3 | 0 | 3 |
| B3GNTL1 | ZNF230 | 0.697935 | 3 | 0 | 3 |
| B3GNTL1 | FAM24B | 0.679357 | 3 | 0 | 3 |
| B3GNTL1 | WDR83 | 0.66715 | 4 | 0 | 4 |
| B3GNTL1 | ODF3B | 0.663018 | 3 | 0 | 3 |
| B3GNTL1 | NKAIN4 | 0.655251 | 3 | 0 | 3 |
| B3GNTL1 | ABCA7 | 0.651477 | 3 | 0 | 3 |
| B3GNTL1 | TIMM10 | 0.640337 | 4 | 0 | 3 |
| B3GNTL1 | CCL17 | 0.639323 | 3 | 0 | 3 |
| B3GNTL1 | SPATA2L | 0.635739 | 3 | 0 | 3 |
| B3GNTL1 | ISYNA1 | 0.632738 | 4 | 0 | 4 |
| B3GNTL1 | EBP | 0.631212 | 3 | 0 | 3 |
| B3GNTL1 | CDC34 | 0.629795 | 3 | 0 | 3 |
| B3GNTL1 | ADM5 | 0.625948 | 3 | 0 | 3 |
| B3GNTL1 | ADPRHL2 | 0.625459 | 3 | 0 | 3 |
| B3GNTL1 | DPM3 | 0.622216 | 5 | 0 | 3 |
| B3GNTL1 | OR1F1 | 0.621059 | 3 | 0 | 3 |
| B3GNTL1 | IMPG2 | 0.619439 | 3 | 0 | 3 |
| B3GNTL1 | ZFAT | 0.618239 | 4 | 0 | 3 |
| B3GNTL1 | RFXANK | 0.615401 | 3 | 0 | 3 |
For details and further investigation, click here