| Full name: chromosome 9 open reading frame 78 | Alias Symbol: HSPC220|HCA59|CSU2 | ||
| Type: protein-coding gene | Cytoband: 9q34.11 | ||
| Entrez ID: 51759 | HGNC ID: HGNC:24932 | Ensembl Gene: ENSG00000136819 | OMIM ID: |
Expression of C9orf78:
| Dataset | Gene | EntrezID | Probe | Log2FC | Adj.pValue | Expression |
|---|---|---|---|---|---|---|
| GSE17351 | C9orf78 | 51759 | 218116_at | 0.1292 | 0.7396 | |
| GSE20347 | C9orf78 | 51759 | 218116_at | 0.0794 | 0.5992 | |
| GSE23400 | C9orf78 | 51759 | 218116_at | 0.5656 | 0.0000 | |
| GSE26886 | C9orf78 | 51759 | 218116_at | 0.3995 | 0.0102 | |
| GSE29001 | C9orf78 | 51759 | 218116_at | 0.4771 | 0.0255 | |
| GSE38129 | C9orf78 | 51759 | 218116_at | 0.1009 | 0.3775 | |
| GSE45670 | C9orf78 | 51759 | 218116_at | -0.0059 | 0.9747 | |
| GSE53622 | C9orf78 | 51759 | 90219 | 0.2559 | 0.0000 | |
| GSE53624 | C9orf78 | 51759 | 90219 | 0.2664 | 0.0001 | |
| GSE63941 | C9orf78 | 51759 | 218116_at | -0.8669 | 0.0139 | |
| GSE77861 | C9orf78 | 51759 | 218116_at | 0.2922 | 0.0727 | |
| GSE97050 | C9orf78 | 51759 | A_23_P9443 | 0.1815 | 0.3704 | |
| SRP007169 | C9orf78 | 51759 | RNAseq | 0.5783 | 0.2194 | |
| SRP008496 | C9orf78 | 51759 | RNAseq | 0.6308 | 0.0109 | |
| SRP064894 | C9orf78 | 51759 | RNAseq | 0.3541 | 0.0450 | |
| SRP133303 | C9orf78 | 51759 | RNAseq | 0.2285 | 0.1318 | |
| SRP159526 | C9orf78 | 51759 | RNAseq | 0.4426 | 0.0201 | |
| SRP193095 | C9orf78 | 51759 | RNAseq | 0.0232 | 0.8472 | |
| SRP219564 | C9orf78 | 51759 | RNAseq | -0.3280 | 0.2979 | |
| TCGA | C9orf78 | 51759 | RNAseq | 0.0988 | 0.0529 |
Upregulated datasets: 0; Downregulated datasets: 0.
Survival by C9orf78 expression:
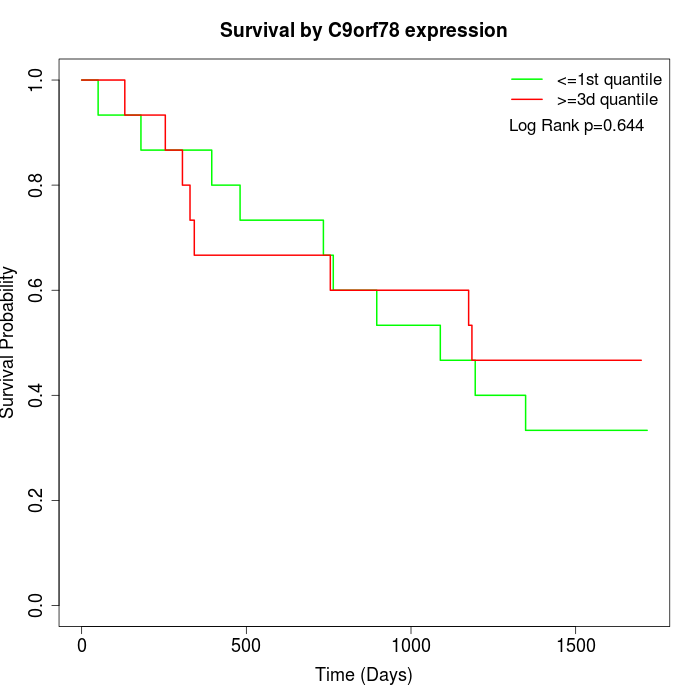 | 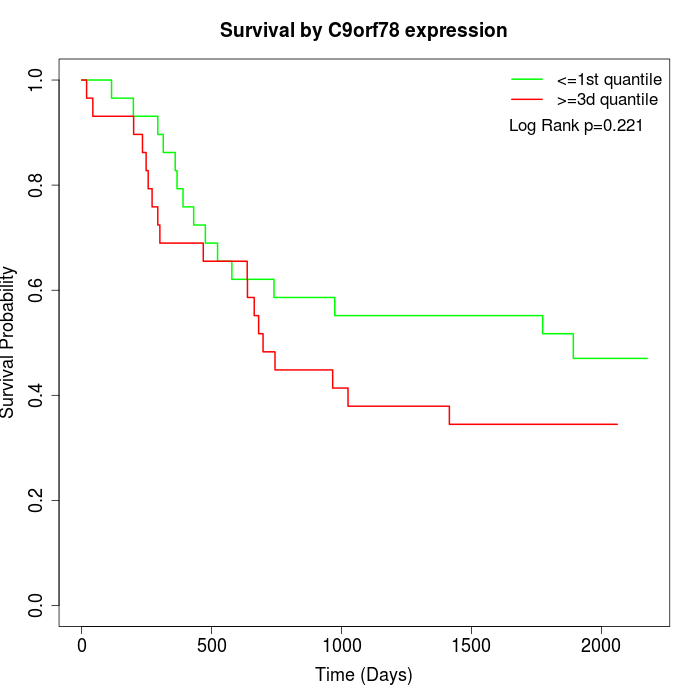 | 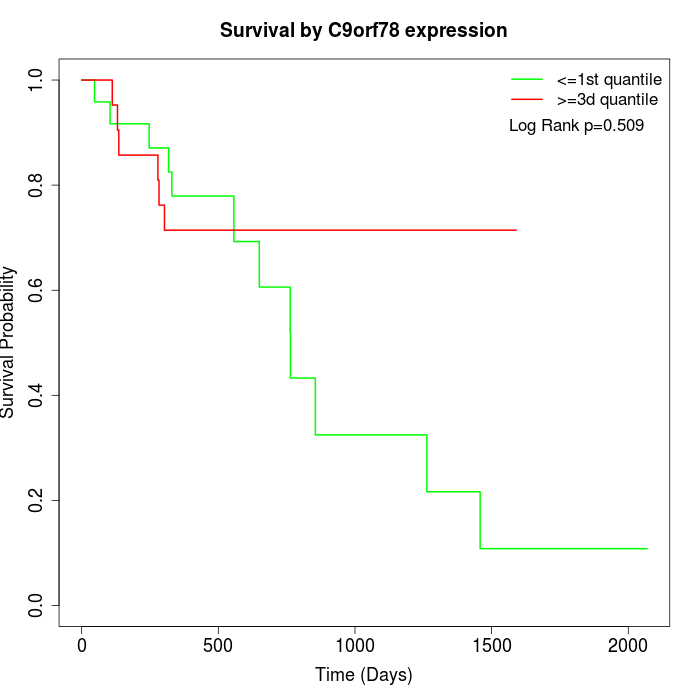 |
| GSE53622 | GSE53624 | TCGA |
Note: Click image to view full size file.
Copy number change of C9orf78:
| Dataset | Gene | EntrezID | Gain | Loss | Normal | Detail |
|---|---|---|---|---|---|---|
| GSE15526 | C9orf78 | 51759 | 6 | 9 | 15 | |
| GSE20123 | C9orf78 | 51759 | 6 | 9 | 15 | |
| GSE43470 | C9orf78 | 51759 | 5 | 7 | 31 | |
| GSE46452 | C9orf78 | 51759 | 6 | 13 | 40 | |
| GSE47630 | C9orf78 | 51759 | 3 | 16 | 21 | |
| GSE54993 | C9orf78 | 51759 | 3 | 3 | 64 | |
| GSE54994 | C9orf78 | 51759 | 12 | 9 | 32 | |
| GSE60625 | C9orf78 | 51759 | 0 | 0 | 11 | |
| GSE74703 | C9orf78 | 51759 | 5 | 5 | 26 | |
| GSE74704 | C9orf78 | 51759 | 3 | 7 | 10 | |
| TCGA | C9orf78 | 51759 | 27 | 26 | 43 |
Total number of gains: 76; Total number of losses: 104; Total Number of normals: 308.
Somatic mutations of C9orf78:
Generating mutation plots.
Highly correlated genes for C9orf78:
Showing top 20/952 corelated genes with mean PCC>0.5.
| Gene1 | Gene2 | Mean PCC | Num. Datasets | Num. PCC<0 | Num. PCC>0.5 |
|---|---|---|---|---|---|
| C9orf78 | ATG4C | 0.821872 | 3 | 0 | 3 |
| C9orf78 | ERLEC1 | 0.808602 | 3 | 0 | 3 |
| C9orf78 | UBR1 | 0.792219 | 3 | 0 | 3 |
| C9orf78 | USE1 | 0.791666 | 3 | 0 | 3 |
| C9orf78 | TMTC3 | 0.784633 | 3 | 0 | 3 |
| C9orf78 | STX2 | 0.779656 | 3 | 0 | 3 |
| C9orf78 | ELOF1 | 0.778031 | 3 | 0 | 3 |
| C9orf78 | GPATCH1 | 0.768223 | 3 | 0 | 3 |
| C9orf78 | SEC22C | 0.764611 | 4 | 0 | 4 |
| C9orf78 | NKAP | 0.753261 | 3 | 0 | 3 |
| C9orf78 | ASB7 | 0.739469 | 3 | 0 | 3 |
| C9orf78 | CYTH3 | 0.739388 | 3 | 0 | 3 |
| C9orf78 | SLC12A4 | 0.738222 | 3 | 0 | 3 |
| C9orf78 | ACBD5 | 0.735036 | 3 | 0 | 3 |
| C9orf78 | BIVM | 0.731928 | 3 | 0 | 3 |
| C9orf78 | ZNF35 | 0.730873 | 3 | 0 | 3 |
| C9orf78 | NCF2 | 0.727697 | 3 | 0 | 3 |
| C9orf78 | ZNF317 | 0.726693 | 4 | 0 | 3 |
| C9orf78 | ZC3H12C | 0.724779 | 3 | 0 | 3 |
| C9orf78 | ATP11C | 0.724396 | 4 | 0 | 4 |
For details and further investigation, click here