| Full name: cyclase associated actin cytoskeleton regulatory protein 1 | Alias Symbol: CAP | ||
| Type: protein-coding gene | Cytoband: 1p34.2 | ||
| Entrez ID: 10487 | HGNC ID: HGNC:20040 | Ensembl Gene: ENSG00000131236 | OMIM ID: 617801 |
Screen Evidence:
| |||
Expression of CAP1:
| Dataset | Gene | EntrezID | Probe | Log2FC | Adj.pValue | Expression |
|---|---|---|---|---|---|---|
| GSE17351 | CAP1 | 10487 | 200625_s_at | -0.0305 | 0.9518 | |
| GSE20347 | CAP1 | 10487 | 200625_s_at | -0.2341 | 0.0720 | |
| GSE23400 | CAP1 | 10487 | 200625_s_at | 0.1727 | 0.0304 | |
| GSE26886 | CAP1 | 10487 | 200625_s_at | -0.0517 | 0.8400 | |
| GSE29001 | CAP1 | 10487 | 213798_s_at | -0.0950 | 0.6974 | |
| GSE38129 | CAP1 | 10487 | 200625_s_at | -0.2019 | 0.1046 | |
| GSE45670 | CAP1 | 10487 | 200625_s_at | 0.2234 | 0.1971 | |
| GSE53622 | CAP1 | 10487 | 50668 | -0.1400 | 0.0559 | |
| GSE53624 | CAP1 | 10487 | 117583 | 0.1910 | 0.0018 | |
| GSE63941 | CAP1 | 10487 | 213798_s_at | -1.1144 | 0.0546 | |
| GSE77861 | CAP1 | 10487 | 200625_s_at | 0.2649 | 0.3702 | |
| GSE97050 | CAP1 | 10487 | A_33_P3281816 | 0.0176 | 0.9497 | |
| SRP007169 | CAP1 | 10487 | RNAseq | -0.5677 | 0.1327 | |
| SRP008496 | CAP1 | 10487 | RNAseq | -0.6099 | 0.0085 | |
| SRP064894 | CAP1 | 10487 | RNAseq | -0.1772 | 0.5732 | |
| SRP133303 | CAP1 | 10487 | RNAseq | 0.4034 | 0.0795 | |
| SRP159526 | CAP1 | 10487 | RNAseq | 0.6398 | 0.3760 | |
| SRP193095 | CAP1 | 10487 | RNAseq | -0.0506 | 0.7284 | |
| SRP219564 | CAP1 | 10487 | RNAseq | 0.0472 | 0.9323 | |
| TCGA | CAP1 | 10487 | RNAseq | 0.0901 | 0.1241 |
Upregulated datasets: 0; Downregulated datasets: 0.
Survival by CAP1 expression:
 | 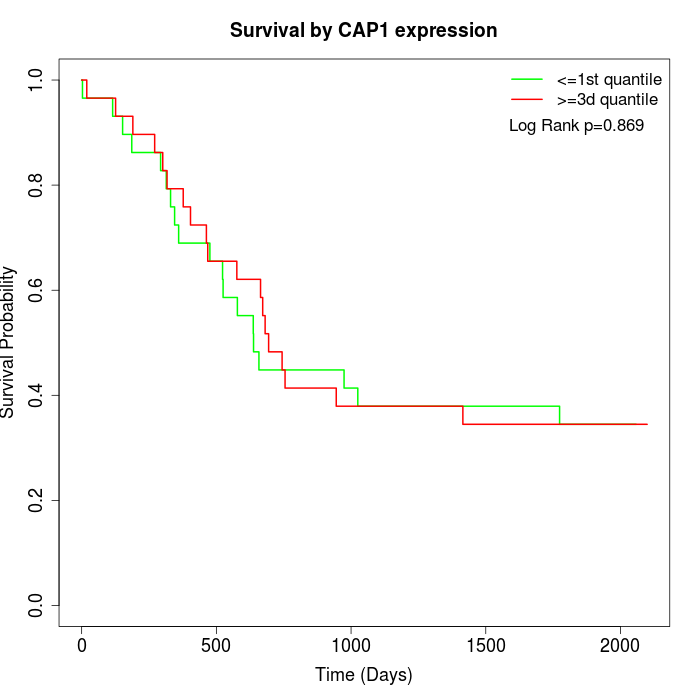 | 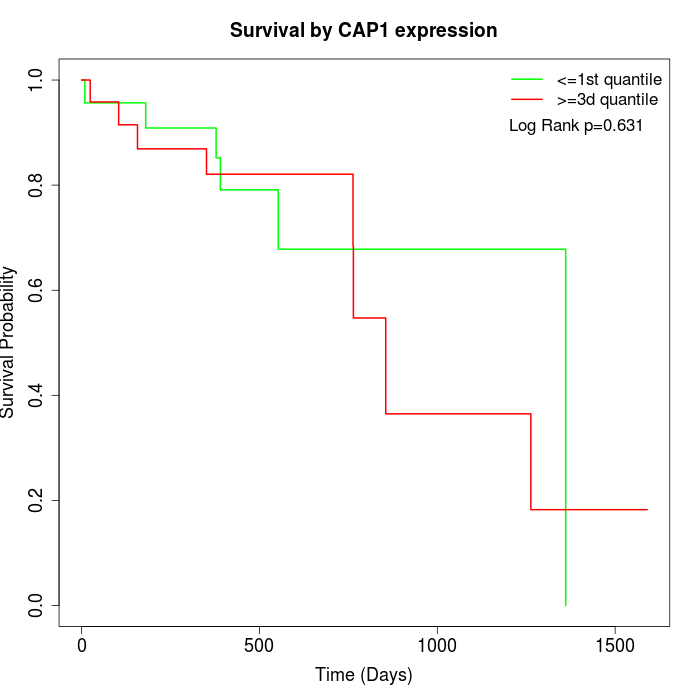 |
| GSE53622 | GSE53624 | TCGA |
Note: Click image to view full size file.
Copy number change of CAP1:
| Dataset | Gene | EntrezID | Gain | Loss | Normal | Detail |
|---|---|---|---|---|---|---|
| GSE15526 | CAP1 | 10487 | 3 | 4 | 23 | |
| GSE20123 | CAP1 | 10487 | 2 | 3 | 25 | |
| GSE43470 | CAP1 | 10487 | 7 | 2 | 34 | |
| GSE46452 | CAP1 | 10487 | 4 | 1 | 54 | |
| GSE47630 | CAP1 | 10487 | 9 | 2 | 29 | |
| GSE54993 | CAP1 | 10487 | 0 | 1 | 69 | |
| GSE54994 | CAP1 | 10487 | 13 | 2 | 38 | |
| GSE60625 | CAP1 | 10487 | 0 | 0 | 11 | |
| GSE74703 | CAP1 | 10487 | 6 | 1 | 29 | |
| GSE74704 | CAP1 | 10487 | 1 | 0 | 19 | |
| TCGA | CAP1 | 10487 | 16 | 16 | 64 |
Total number of gains: 61; Total number of losses: 32; Total Number of normals: 395.
Somatic mutations of CAP1:
Generating mutation plots.
Highly correlated genes for CAP1:
Showing top 20/247 corelated genes with mean PCC>0.5.
| Gene1 | Gene2 | Mean PCC | Num. Datasets | Num. PCC<0 | Num. PCC>0.5 |
|---|---|---|---|---|---|
| CAP1 | OTUD7B | 0.76038 | 3 | 0 | 3 |
| CAP1 | TTC37 | 0.739336 | 3 | 0 | 3 |
| CAP1 | AGBL5 | 0.71321 | 3 | 0 | 3 |
| CAP1 | SLC37A3 | 0.690847 | 3 | 0 | 3 |
| CAP1 | BOD1 | 0.685293 | 3 | 0 | 3 |
| CAP1 | BUD31 | 0.669277 | 3 | 0 | 3 |
| CAP1 | IPO7 | 0.668103 | 3 | 0 | 3 |
| CAP1 | STX10 | 0.660582 | 3 | 0 | 3 |
| CAP1 | AKIRIN1 | 0.659356 | 7 | 0 | 7 |
| CAP1 | ZNF746 | 0.651353 | 3 | 0 | 3 |
| CAP1 | TPRG1L | 0.650567 | 3 | 0 | 3 |
| CAP1 | HSPA9 | 0.642563 | 3 | 0 | 3 |
| CAP1 | FKBP3 | 0.634798 | 4 | 0 | 3 |
| CAP1 | CCNY | 0.63474 | 3 | 0 | 3 |
| CAP1 | SLC2A3 | 0.631283 | 3 | 0 | 3 |
| CAP1 | MFF | 0.630059 | 4 | 0 | 3 |
| CAP1 | UBE2H | 0.62546 | 4 | 0 | 3 |
| CAP1 | TRIM23 | 0.625209 | 3 | 0 | 3 |
| CAP1 | ZNF578 | 0.625038 | 3 | 0 | 3 |
| CAP1 | C1orf122 | 0.62323 | 7 | 0 | 5 |
For details and further investigation, click here