| Full name: cell division cycle and apoptosis regulator 1 | Alias Symbol: FLJ10590|CARP-1|CARP1 | ||
| Type: protein-coding gene | Cytoband: 10q21.3 | ||
| Entrez ID: 55749 | HGNC ID: HGNC:24236 | Ensembl Gene: ENSG00000060339 | OMIM ID: 612569 |
Screen Evidence:
| |||
Expression of CCAR1:
| Dataset | Gene | EntrezID | Probe | Log2FC | Adj.pValue | Expression |
|---|---|---|---|---|---|---|
| GSE17351 | CCAR1 | 55749 | 224736_at | 0.3010 | 0.5416 | |
| GSE26886 | CCAR1 | 55749 | 224736_at | 0.5154 | 0.0083 | |
| GSE45670 | CCAR1 | 55749 | 224736_at | 0.4197 | 0.0001 | |
| GSE53622 | CCAR1 | 55749 | 81354 | 0.3401 | 0.0000 | |
| GSE53624 | CCAR1 | 55749 | 81354 | 0.6338 | 0.0000 | |
| GSE63941 | CCAR1 | 55749 | 224736_at | -1.0066 | 0.0039 | |
| GSE77861 | CCAR1 | 55749 | 224736_at | 0.5950 | 0.0851 | |
| GSE97050 | CCAR1 | 55749 | A_23_P115842 | 0.0878 | 0.6428 | |
| SRP007169 | CCAR1 | 55749 | RNAseq | 1.0118 | 0.0083 | |
| SRP008496 | CCAR1 | 55749 | RNAseq | 1.0024 | 0.0004 | |
| SRP064894 | CCAR1 | 55749 | RNAseq | 0.3296 | 0.0109 | |
| SRP133303 | CCAR1 | 55749 | RNAseq | 0.4166 | 0.0000 | |
| SRP159526 | CCAR1 | 55749 | RNAseq | 0.0434 | 0.8020 | |
| SRP193095 | CCAR1 | 55749 | RNAseq | 0.0993 | 0.2391 | |
| SRP219564 | CCAR1 | 55749 | RNAseq | 0.2376 | 0.4178 | |
| TCGA | CCAR1 | 55749 | RNAseq | 0.0248 | 0.5883 |
Upregulated datasets: 2; Downregulated datasets: 1.
Survival by CCAR1 expression:
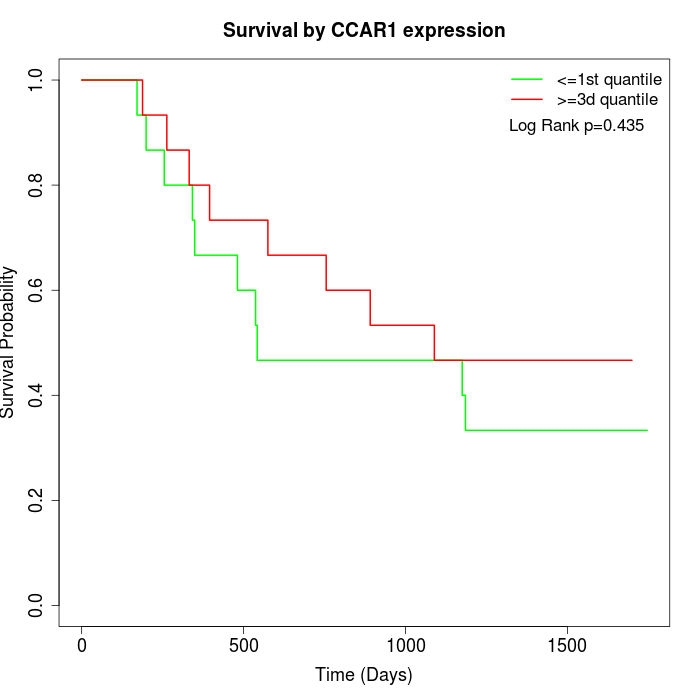 | 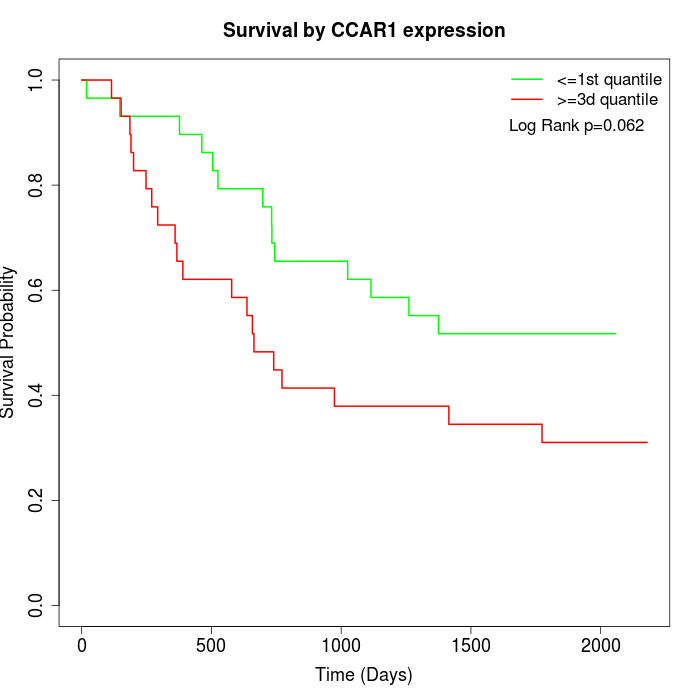 | 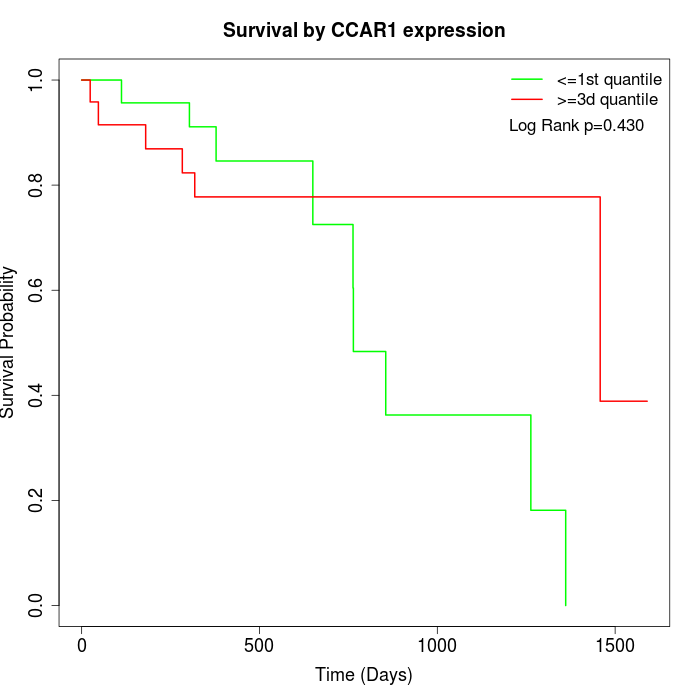 |
| GSE53622 | GSE53624 | TCGA |
Note: Click image to view full size file.
Copy number change of CCAR1:
| Dataset | Gene | EntrezID | Gain | Loss | Normal | Detail |
|---|---|---|---|---|---|---|
| GSE15526 | CCAR1 | 55749 | 3 | 4 | 23 | |
| GSE20123 | CCAR1 | 55749 | 3 | 3 | 24 | |
| GSE43470 | CCAR1 | 55749 | 1 | 8 | 34 | |
| GSE46452 | CCAR1 | 55749 | 0 | 11 | 48 | |
| GSE47630 | CCAR1 | 55749 | 2 | 14 | 24 | |
| GSE54993 | CCAR1 | 55749 | 8 | 0 | 62 | |
| GSE54994 | CCAR1 | 55749 | 2 | 12 | 39 | |
| GSE60625 | CCAR1 | 55749 | 0 | 0 | 11 | |
| GSE74703 | CCAR1 | 55749 | 1 | 5 | 30 | |
| GSE74704 | CCAR1 | 55749 | 1 | 1 | 18 | |
| TCGA | CCAR1 | 55749 | 10 | 22 | 64 |
Total number of gains: 31; Total number of losses: 80; Total Number of normals: 377.
Somatic mutations of CCAR1:
Generating mutation plots.
Highly correlated genes for CCAR1:
Showing top 20/848 corelated genes with mean PCC>0.5.
| Gene1 | Gene2 | Mean PCC | Num. Datasets | Num. PCC<0 | Num. PCC>0.5 |
|---|---|---|---|---|---|
| CCAR1 | ARID1B | 0.818511 | 3 | 0 | 3 |
| CCAR1 | TOMM40L | 0.806228 | 3 | 0 | 3 |
| CCAR1 | NUFIP1 | 0.804828 | 3 | 0 | 3 |
| CCAR1 | NBEAL1 | 0.804612 | 3 | 0 | 3 |
| CCAR1 | ZNF544 | 0.798909 | 3 | 0 | 3 |
| CCAR1 | SPIRE2 | 0.786482 | 3 | 0 | 3 |
| CCAR1 | NKTR | 0.774288 | 4 | 0 | 4 |
| CCAR1 | PTPN23 | 0.772764 | 3 | 0 | 3 |
| CCAR1 | FIP1L1 | 0.77226 | 4 | 0 | 3 |
| CCAR1 | PPIG | 0.769451 | 5 | 0 | 5 |
| CCAR1 | DDX59 | 0.768931 | 5 | 0 | 5 |
| CCAR1 | ATP11C | 0.765729 | 3 | 0 | 3 |
| CCAR1 | RBM41 | 0.75821 | 4 | 0 | 4 |
| CCAR1 | CEP350 | 0.752525 | 3 | 0 | 3 |
| CCAR1 | RING1 | 0.752115 | 3 | 0 | 3 |
| CCAR1 | NEK7 | 0.750825 | 3 | 0 | 3 |
| CCAR1 | MRPL9 | 0.744327 | 4 | 0 | 3 |
| CCAR1 | TRMT61A | 0.744223 | 3 | 0 | 3 |
| CCAR1 | ZNF513 | 0.739629 | 3 | 0 | 3 |
| CCAR1 | CASP8AP2 | 0.738153 | 3 | 0 | 3 |
For details and further investigation, click here