| Full name: nuclear FMR1 interacting protein 1 | Alias Symbol: NUFIP | ||
| Type: protein-coding gene | Cytoband: 13q14.12 | ||
| Entrez ID: 26747 | HGNC ID: HGNC:8057 | Ensembl Gene: ENSG00000083635 | OMIM ID: 604354 |
Screen Evidence:
| |||
Expression of NUFIP1:
| Dataset | Gene | EntrezID | Probe | Log2FC | Adj.pValue | Expression |
|---|---|---|---|---|---|---|
| GSE17351 | NUFIP1 | 26747 | 205134_s_at | 0.6064 | 0.4729 | |
| GSE20347 | NUFIP1 | 26747 | 205134_s_at | 0.0717 | 0.5119 | |
| GSE23400 | NUFIP1 | 26747 | 205134_s_at | 0.0384 | 0.3492 | |
| GSE26886 | NUFIP1 | 26747 | 205136_s_at | -0.2205 | 0.4211 | |
| GSE29001 | NUFIP1 | 26747 | 205136_s_at | 0.0984 | 0.7604 | |
| GSE38129 | NUFIP1 | 26747 | 205134_s_at | 0.2189 | 0.0327 | |
| GSE45670 | NUFIP1 | 26747 | 205134_s_at | 0.1246 | 0.4792 | |
| GSE53622 | NUFIP1 | 26747 | 27520 | 0.2728 | 0.0000 | |
| GSE53624 | NUFIP1 | 26747 | 27520 | 0.3917 | 0.0000 | |
| GSE63941 | NUFIP1 | 26747 | 205135_s_at | -0.2780 | 0.4823 | |
| GSE77861 | NUFIP1 | 26747 | 205135_s_at | 0.0673 | 0.7337 | |
| GSE97050 | NUFIP1 | 26747 | A_23_P36939 | 0.1648 | 0.4458 | |
| SRP007169 | NUFIP1 | 26747 | RNAseq | 0.5495 | 0.3183 | |
| SRP008496 | NUFIP1 | 26747 | RNAseq | 0.8500 | 0.0449 | |
| SRP064894 | NUFIP1 | 26747 | RNAseq | 0.2769 | 0.0973 | |
| SRP133303 | NUFIP1 | 26747 | RNAseq | 0.2044 | 0.2462 | |
| SRP159526 | NUFIP1 | 26747 | RNAseq | 0.0006 | 0.9978 | |
| SRP193095 | NUFIP1 | 26747 | RNAseq | 0.2776 | 0.0406 | |
| SRP219564 | NUFIP1 | 26747 | RNAseq | 0.0644 | 0.8360 | |
| TCGA | NUFIP1 | 26747 | RNAseq | 0.0760 | 0.2775 |
Upregulated datasets: 0; Downregulated datasets: 0.
Survival by NUFIP1 expression:
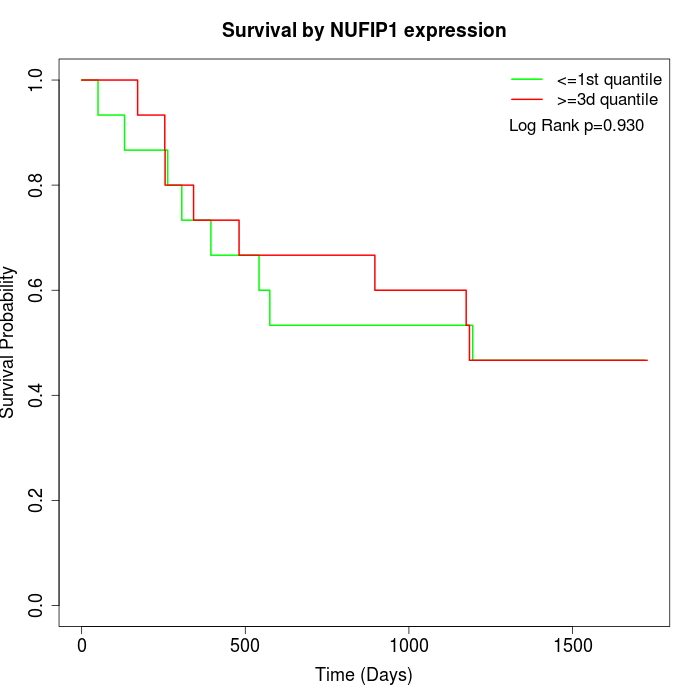 | 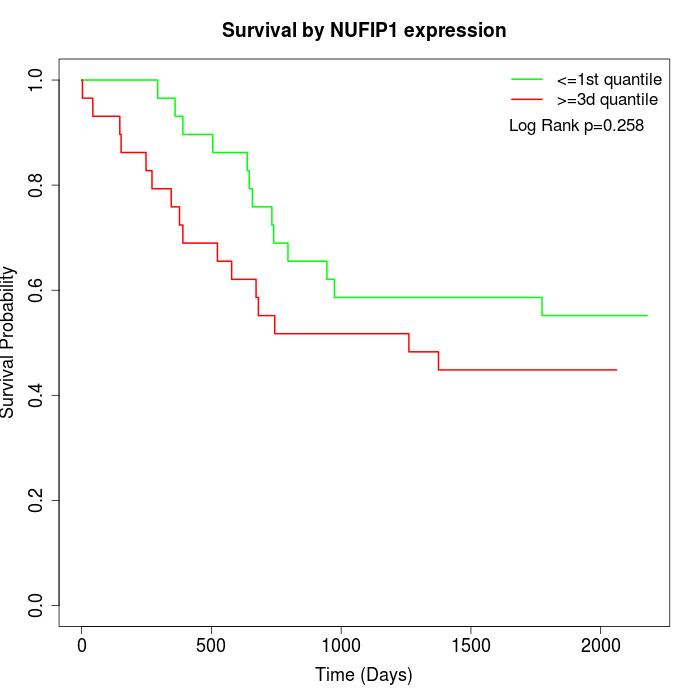 | 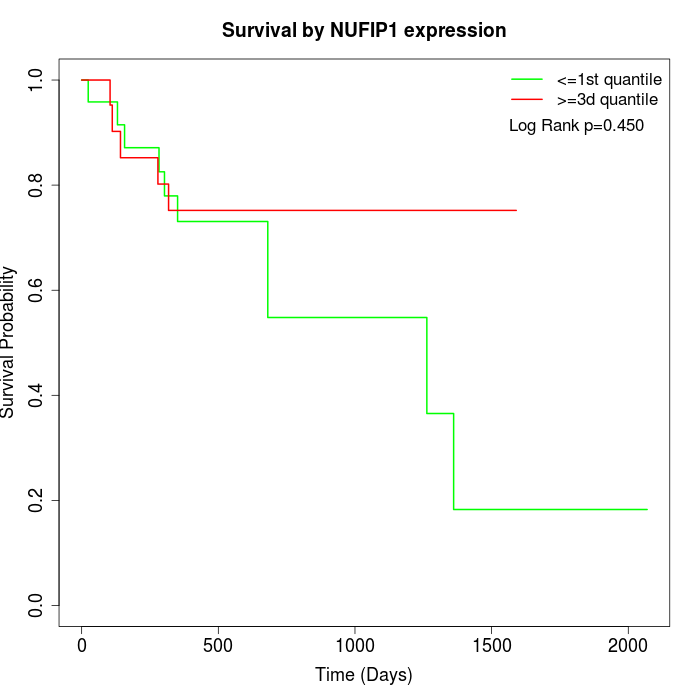 |
| GSE53622 | GSE53624 | TCGA |
Note: Click image to view full size file.
Copy number change of NUFIP1:
| Dataset | Gene | EntrezID | Gain | Loss | Normal | Detail |
|---|---|---|---|---|---|---|
| GSE15526 | NUFIP1 | 26747 | 0 | 13 | 17 | |
| GSE20123 | NUFIP1 | 26747 | 0 | 12 | 18 | |
| GSE43470 | NUFIP1 | 26747 | 3 | 13 | 27 | |
| GSE46452 | NUFIP1 | 26747 | 0 | 33 | 26 | |
| GSE47630 | NUFIP1 | 26747 | 2 | 27 | 11 | |
| GSE54993 | NUFIP1 | 26747 | 12 | 2 | 56 | |
| GSE54994 | NUFIP1 | 26747 | 1 | 16 | 36 | |
| GSE60625 | NUFIP1 | 26747 | 0 | 3 | 8 | |
| GSE74703 | NUFIP1 | 26747 | 3 | 10 | 23 | |
| GSE74704 | NUFIP1 | 26747 | 0 | 9 | 11 | |
| TCGA | NUFIP1 | 26747 | 9 | 39 | 48 |
Total number of gains: 30; Total number of losses: 177; Total Number of normals: 281.
Somatic mutations of NUFIP1:
Generating mutation plots.
Highly correlated genes for NUFIP1:
Showing top 20/365 corelated genes with mean PCC>0.5.
| Gene1 | Gene2 | Mean PCC | Num. Datasets | Num. PCC<0 | Num. PCC>0.5 |
|---|---|---|---|---|---|
| NUFIP1 | CCAR1 | 0.804828 | 3 | 0 | 3 |
| NUFIP1 | CTBP2 | 0.765992 | 3 | 0 | 3 |
| NUFIP1 | PTPN23 | 0.76141 | 3 | 0 | 3 |
| NUFIP1 | INTS9 | 0.75555 | 3 | 0 | 3 |
| NUFIP1 | TRAPPC10 | 0.749937 | 3 | 0 | 3 |
| NUFIP1 | PPP1R37 | 0.749421 | 3 | 0 | 3 |
| NUFIP1 | ASH1L | 0.745944 | 3 | 0 | 3 |
| NUFIP1 | PTOV1 | 0.740184 | 3 | 0 | 3 |
| NUFIP1 | MAP2K7 | 0.739358 | 3 | 0 | 3 |
| NUFIP1 | SLC22A5 | 0.733164 | 4 | 0 | 4 |
| NUFIP1 | PKP4 | 0.732825 | 3 | 0 | 3 |
| NUFIP1 | CRTC2 | 0.731379 | 3 | 0 | 3 |
| NUFIP1 | ZNF121 | 0.725224 | 3 | 0 | 3 |
| NUFIP1 | BCL9L | 0.721277 | 3 | 0 | 3 |
| NUFIP1 | EIF5 | 0.687896 | 3 | 0 | 3 |
| NUFIP1 | PTPN4 | 0.685334 | 4 | 0 | 3 |
| NUFIP1 | LIMS1 | 0.685261 | 3 | 0 | 3 |
| NUFIP1 | HAUS3 | 0.683493 | 3 | 0 | 3 |
| NUFIP1 | ANAPC4 | 0.683248 | 3 | 0 | 3 |
| NUFIP1 | KBTBD4 | 0.667927 | 3 | 0 | 3 |
For details and further investigation, click here