| Full name: carbamoyl-phosphate synthase 1 | Alias Symbol: | ||
| Type: protein-coding gene | Cytoband: 2q34 | ||
| Entrez ID: 1373 | HGNC ID: HGNC:2323 | Ensembl Gene: ENSG00000021826 | OMIM ID: 608307 |
| Related drugs: CARGLUMIC ACID... [more] | |||
Expression of CPS1:
| Dataset | Gene | EntrezID | Probe | Log2FC | Adj.pValue | Expression |
|---|---|---|---|---|---|---|
| GSE17351 | CPS1 | 1373 | 204920_at | -0.8676 | 0.0636 | |
| GSE20347 | CPS1 | 1373 | 204920_at | -0.6067 | 0.0031 | |
| GSE23400 | CPS1 | 1373 | 204920_at | -0.2439 | 0.0000 | |
| GSE26886 | CPS1 | 1373 | 204920_at | -1.0029 | 0.0036 | |
| GSE29001 | CPS1 | 1373 | 204920_at | -1.3426 | 0.0085 | |
| GSE38129 | CPS1 | 1373 | 204920_at | -0.8644 | 0.0000 | |
| GSE45670 | CPS1 | 1373 | 204920_at | -0.7216 | 0.0148 | |
| GSE53622 | CPS1 | 1373 | 40502 | -1.4985 | 0.0000 | |
| GSE53624 | CPS1 | 1373 | 40502 | -1.5351 | 0.0000 | |
| GSE63941 | CPS1 | 1373 | 204920_at | -0.4816 | 0.7915 | |
| GSE77861 | CPS1 | 1373 | 204920_at | -0.5512 | 0.0060 | |
| SRP064894 | CPS1 | 1373 | RNAseq | -1.7815 | 0.0000 | |
| SRP133303 | CPS1 | 1373 | RNAseq | -1.0790 | 0.0108 | |
| SRP159526 | CPS1 | 1373 | RNAseq | -0.5917 | 0.4642 | |
| SRP193095 | CPS1 | 1373 | RNAseq | -1.7981 | 0.0000 | |
| TCGA | CPS1 | 1373 | RNAseq | -0.3577 | 0.3594 |
Upregulated datasets: 0; Downregulated datasets: 7.
Survival by CPS1 expression:
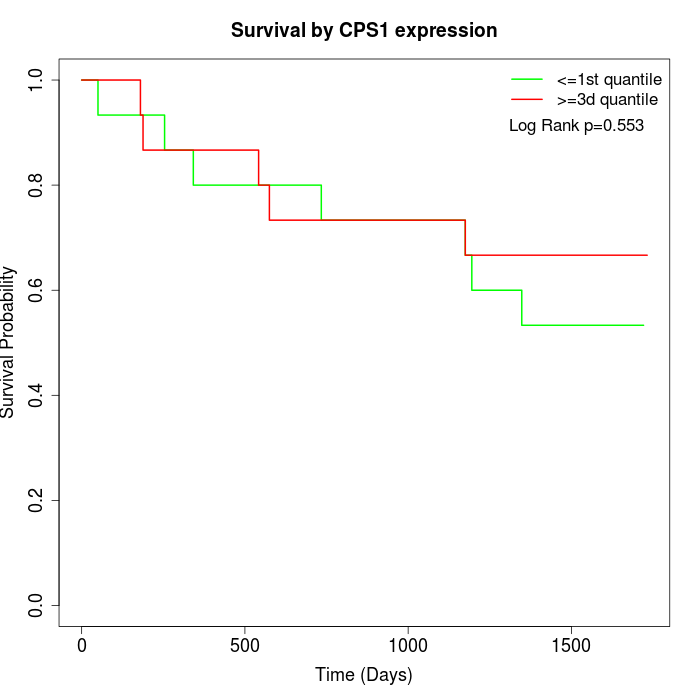 | 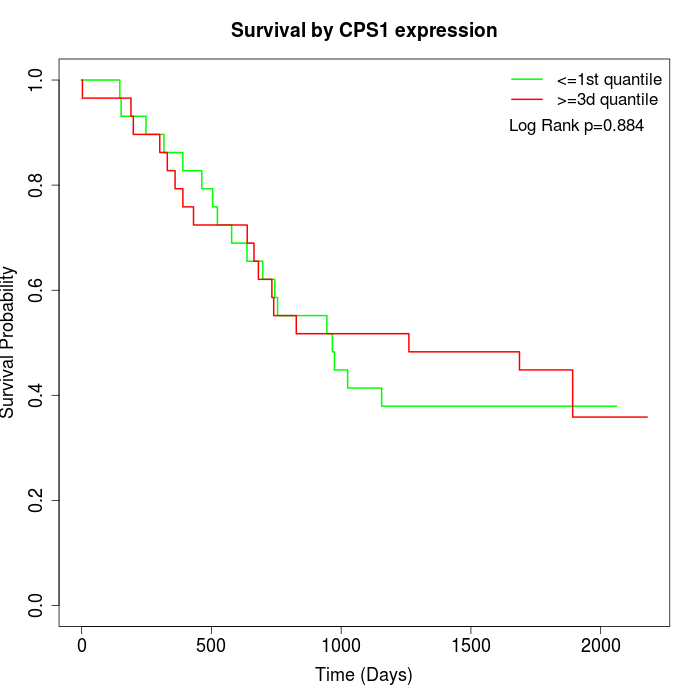 |  |
| GSE53622 | GSE53624 | TCGA |
Note: Click image to view full size file.
Copy number change of CPS1:
| Dataset | Gene | EntrezID | Gain | Loss | Normal | Detail |
|---|---|---|---|---|---|---|
| GSE15526 | CPS1 | 1373 | 2 | 12 | 16 | |
| GSE20123 | CPS1 | 1373 | 2 | 12 | 16 | |
| GSE43470 | CPS1 | 1373 | 1 | 6 | 36 | |
| GSE46452 | CPS1 | 1373 | 0 | 5 | 54 | |
| GSE47630 | CPS1 | 1373 | 4 | 5 | 31 | |
| GSE54993 | CPS1 | 1373 | 0 | 4 | 66 | |
| GSE54994 | CPS1 | 1373 | 9 | 9 | 35 | |
| GSE60625 | CPS1 | 1373 | 0 | 3 | 8 | |
| GSE74703 | CPS1 | 1373 | 1 | 5 | 30 | |
| GSE74704 | CPS1 | 1373 | 2 | 6 | 12 | |
| TCGA | CPS1 | 1373 | 12 | 26 | 58 |
Total number of gains: 33; Total number of losses: 93; Total Number of normals: 362.
Somatic mutations of CPS1:
Generating mutation plots.
Highly correlated genes for CPS1:
Showing top 20/770 corelated genes with mean PCC>0.5.
| Gene1 | Gene2 | Mean PCC | Num. Datasets | Num. PCC<0 | Num. PCC>0.5 |
|---|---|---|---|---|---|
| CPS1 | ARF4 | 0.700766 | 3 | 0 | 3 |
| CPS1 | ZNF416 | 0.699135 | 3 | 0 | 3 |
| CPS1 | SFTA2 | 0.692205 | 5 | 0 | 5 |
| CPS1 | PDZRN3 | 0.678503 | 4 | 0 | 3 |
| CPS1 | SPINK7 | 0.675095 | 6 | 0 | 6 |
| CPS1 | SNORA68 | 0.658129 | 4 | 0 | 4 |
| CPS1 | RAET1E | 0.657425 | 6 | 0 | 6 |
| CPS1 | MPP7 | 0.657307 | 6 | 0 | 6 |
| CPS1 | KRT78 | 0.652639 | 6 | 0 | 6 |
| CPS1 | TMPRSS11B | 0.652372 | 6 | 0 | 6 |
| CPS1 | THRB | 0.650469 | 3 | 0 | 3 |
| CPS1 | HCG22 | 0.649743 | 6 | 0 | 6 |
| CPS1 | TSPYL1 | 0.647056 | 4 | 0 | 3 |
| CPS1 | GANC | 0.646029 | 6 | 0 | 5 |
| CPS1 | ANKRD35 | 0.644769 | 6 | 0 | 6 |
| CPS1 | CYP4F12 | 0.643857 | 7 | 0 | 6 |
| CPS1 | CPPED1 | 0.641336 | 8 | 0 | 8 |
| CPS1 | A2ML1 | 0.641046 | 6 | 0 | 6 |
| CPS1 | VSIG10L | 0.640703 | 6 | 0 | 6 |
| CPS1 | SKP1 | 0.639848 | 4 | 0 | 4 |
For details and further investigation, click here