| Full name: casein beta | Alias Symbol: | ||
| Type: protein-coding gene | Cytoband: 4q13.3 | ||
| Entrez ID: 1447 | HGNC ID: HGNC:2447 | Ensembl Gene: ENSG00000135222 | OMIM ID: 115460 |
CSN2 involved pathways:
| KEGG pathway | Description | View |
|---|---|---|
| hsa04917 | Prolactin signaling pathway |
Expression of CSN2:
| Dataset | Gene | EntrezID | Probe | Log2FC | Adj.pValue | Expression |
|---|---|---|---|---|---|---|
| GSE17351 | CSN2 | 1447 | 207951_at | -0.1445 | 0.3945 | |
| GSE20347 | CSN2 | 1447 | 207951_at | 0.1166 | 0.5054 | |
| GSE23400 | CSN2 | 1447 | 207951_at | -0.0990 | 0.0028 | |
| GSE26886 | CSN2 | 1447 | 207951_at | 0.0291 | 0.8077 | |
| GSE29001 | CSN2 | 1447 | 207951_at | -0.1002 | 0.3852 | |
| GSE38129 | CSN2 | 1447 | 207951_at | -0.0295 | 0.8180 | |
| GSE45670 | CSN2 | 1447 | 207951_at | 0.1138 | 0.0694 | |
| GSE53622 | CSN2 | 1447 | 51959 | 0.2424 | 0.0779 | |
| GSE53624 | CSN2 | 1447 | 51959 | -0.1000 | 0.3872 | |
| GSE63941 | CSN2 | 1447 | 207951_at | -0.1018 | 0.3717 | |
| GSE77861 | CSN2 | 1447 | 207951_at | -0.0413 | 0.6777 | |
| TCGA | CSN2 | 1447 | RNAseq | -2.0141 | 0.1598 |
Upregulated datasets: 0; Downregulated datasets: 0.
Survival by CSN2 expression:
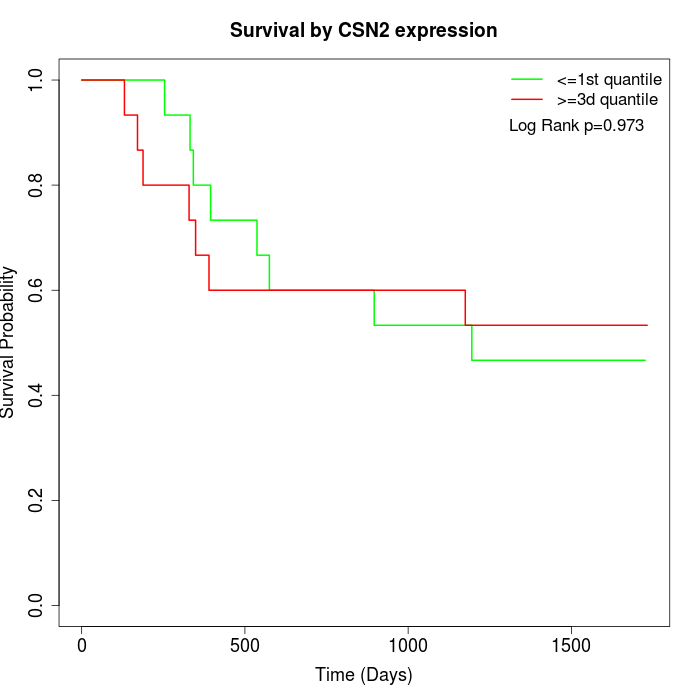 | 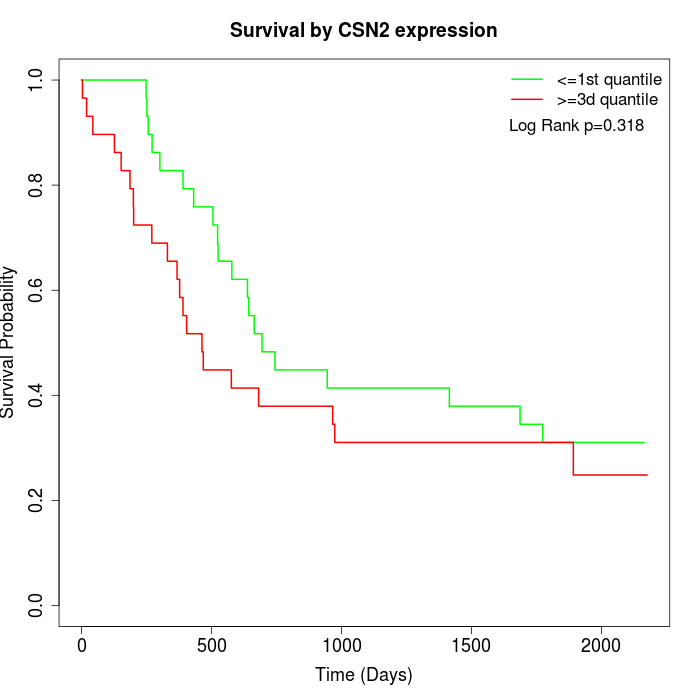 | 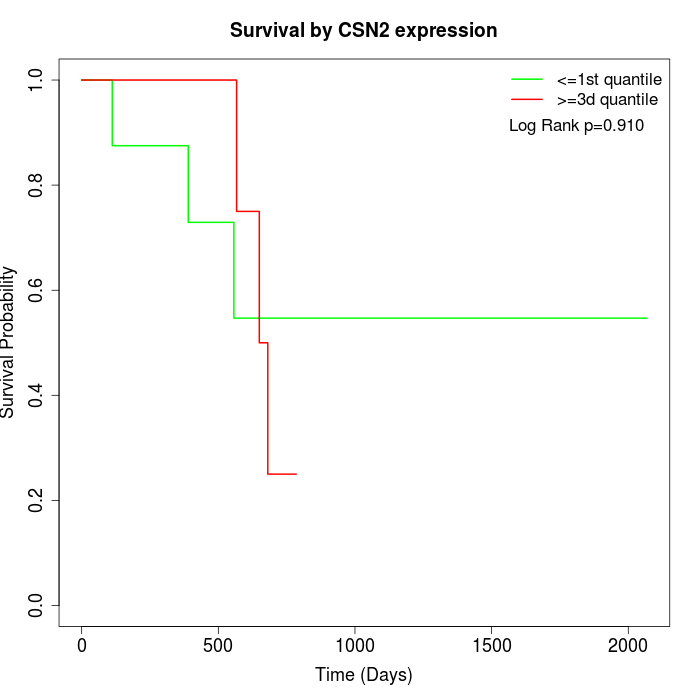 |
| GSE53622 | GSE53624 | TCGA |
Note: Click image to view full size file.
Copy number change of CSN2:
| Dataset | Gene | EntrezID | Gain | Loss | Normal | Detail |
|---|---|---|---|---|---|---|
| GSE15526 | CSN2 | 1447 | 0 | 10 | 20 | |
| GSE20123 | CSN2 | 1447 | 0 | 11 | 19 | |
| GSE43470 | CSN2 | 1447 | 0 | 13 | 30 | |
| GSE46452 | CSN2 | 1447 | 2 | 35 | 22 | |
| GSE47630 | CSN2 | 1447 | 1 | 18 | 21 | |
| GSE54993 | CSN2 | 1447 | 7 | 0 | 63 | |
| GSE54994 | CSN2 | 1447 | 1 | 9 | 43 | |
| GSE60625 | CSN2 | 1447 | 0 | 0 | 11 | |
| GSE74703 | CSN2 | 1447 | 0 | 11 | 25 | |
| GSE74704 | CSN2 | 1447 | 0 | 7 | 13 | |
| TCGA | CSN2 | 1447 | 15 | 28 | 53 |
Total number of gains: 26; Total number of losses: 142; Total Number of normals: 320.
Somatic mutations of CSN2:
Generating mutation plots.
Highly correlated genes for CSN2:
Showing top 20/250 corelated genes with mean PCC>0.5.
| Gene1 | Gene2 | Mean PCC | Num. Datasets | Num. PCC<0 | Num. PCC>0.5 |
|---|---|---|---|---|---|
| CSN2 | CSN3 | 0.744106 | 7 | 0 | 7 |
| CSN2 | IL5RA | 0.73227 | 3 | 0 | 3 |
| CSN2 | EPB42 | 0.71921 | 3 | 0 | 3 |
| CSN2 | MPL | 0.715451 | 3 | 0 | 3 |
| CSN2 | FABP7 | 0.711205 | 5 | 0 | 3 |
| CSN2 | OR2H2 | 0.701133 | 3 | 0 | 3 |
| CSN2 | XPNPEP2 | 0.700038 | 4 | 0 | 4 |
| CSN2 | NEUROD1 | 0.692965 | 3 | 0 | 3 |
| CSN2 | GFRA1 | 0.689025 | 5 | 0 | 4 |
| CSN2 | ITGA10 | 0.679787 | 4 | 0 | 3 |
| CSN2 | ATRNL1 | 0.672481 | 5 | 0 | 5 |
| CSN2 | SEZ6L | 0.669605 | 4 | 0 | 4 |
| CSN2 | KCND3 | 0.668267 | 4 | 0 | 3 |
| CSN2 | PSG9 | 0.663791 | 3 | 0 | 3 |
| CSN2 | PDE1C | 0.662079 | 3 | 0 | 3 |
| CSN2 | OVGP1 | 0.66142 | 3 | 0 | 3 |
| CSN2 | ADAM7 | 0.657548 | 3 | 0 | 3 |
| CSN2 | LIPC | 0.653311 | 3 | 0 | 3 |
| CSN2 | GH1 | 0.651432 | 3 | 0 | 3 |
| CSN2 | RALYL | 0.647244 | 3 | 0 | 3 |
For details and further investigation, click here