| Full name: growth hormone 1 | Alias Symbol: GH-N|GHN|GH|hGH-N | ||
| Type: protein-coding gene | Cytoband: 17q23.3 | ||
| Entrez ID: 2688 | HGNC ID: HGNC:4261 | Ensembl Gene: ENSG00000259384 | OMIM ID: 139250 |
GH1 involved pathways:
| KEGG pathway | Description | View |
|---|---|---|
| hsa04151 | PI3K-Akt signaling pathway | |
| hsa04630 | Jak-STAT signaling pathway |
Expression of GH1:
| Dataset | Gene | EntrezID | Probe | Log2FC | Adj.pValue | Expression |
|---|---|---|---|---|---|---|
| GSE17351 | GH1 | 2688 | 206885_x_at | -0.0155 | 0.9586 | |
| GSE20347 | GH1 | 2688 | 206885_x_at | -0.0495 | 0.6068 | |
| GSE23400 | GH1 | 2688 | 206885_x_at | -0.0597 | 0.1088 | |
| GSE26886 | GH1 | 2688 | 205840_x_at | 0.1907 | 0.0419 | |
| GSE29001 | GH1 | 2688 | 206885_x_at | -0.0905 | 0.4777 | |
| GSE38129 | GH1 | 2688 | 206885_x_at | -0.0877 | 0.2678 | |
| GSE45670 | GH1 | 2688 | 206885_x_at | 0.0812 | 0.4951 | |
| GSE53622 | GH1 | 2688 | 38802 | 0.0419 | 0.5616 | |
| GSE53624 | GH1 | 2688 | 38802 | 0.1182 | 0.2298 | |
| GSE63941 | GH1 | 2688 | 206885_x_at | 0.1814 | 0.2390 | |
| GSE77861 | GH1 | 2688 | 206885_x_at | -0.0025 | 0.9814 | |
| GSE97050 | GH1 | 2688 | A_23_P207194 | -0.0222 | 0.9321 |
Upregulated datasets: 0; Downregulated datasets: 0.
Survival by GH1 expression:
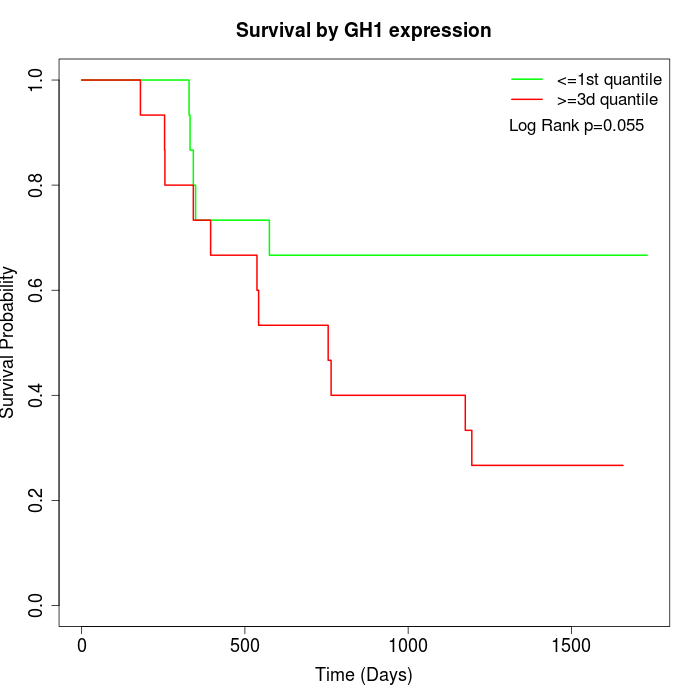 | 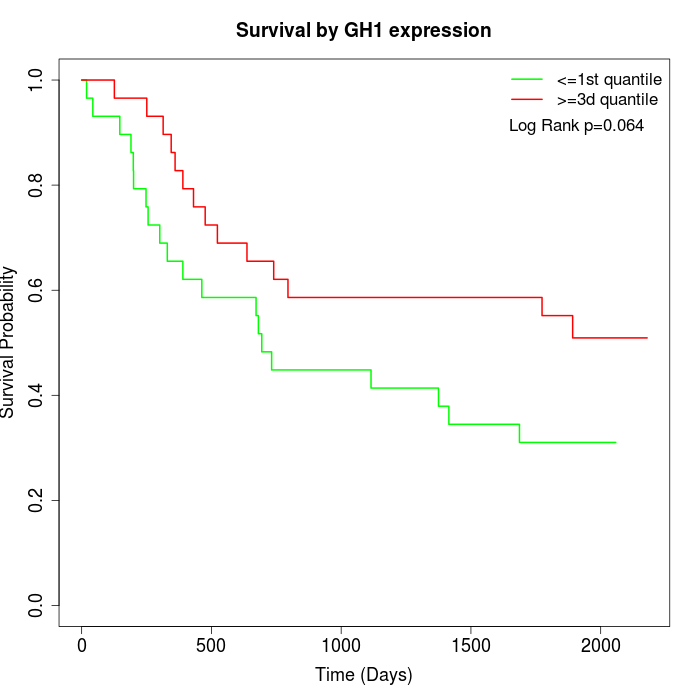 |  |
| GSE53622 | GSE53624 | TCGA |
Note: Click image to view full size file.
Copy number change of GH1:
| Dataset | Gene | EntrezID | Gain | Loss | Normal | Detail |
|---|---|---|---|---|---|---|
| GSE15526 | GH1 | 2688 | 3 | 1 | 26 | |
| GSE20123 | GH1 | 2688 | 3 | 1 | 26 | |
| GSE43470 | GH1 | 2688 | 4 | 0 | 39 | |
| GSE46452 | GH1 | 2688 | 31 | 0 | 28 | |
| GSE47630 | GH1 | 2688 | 7 | 1 | 32 | |
| GSE54993 | GH1 | 2688 | 2 | 5 | 63 | |
| GSE54994 | GH1 | 2688 | 9 | 4 | 40 | |
| GSE60625 | GH1 | 2688 | 4 | 0 | 7 | |
| GSE74703 | GH1 | 2688 | 4 | 0 | 32 | |
| GSE74704 | GH1 | 2688 | 3 | 1 | 16 | |
| TCGA | GH1 | 2688 | 30 | 8 | 58 |
Total number of gains: 100; Total number of losses: 21; Total Number of normals: 367.
Somatic mutations of GH1:
Generating mutation plots.
Highly correlated genes for GH1:
Showing top 20/715 corelated genes with mean PCC>0.5.
| Gene1 | Gene2 | Mean PCC | Num. Datasets | Num. PCC<0 | Num. PCC>0.5 |
|---|---|---|---|---|---|
| GH1 | SPACA3 | 0.903322 | 3 | 0 | 3 |
| GH1 | FBRSL1 | 0.873795 | 3 | 0 | 3 |
| GH1 | STRC | 0.864273 | 3 | 0 | 3 |
| GH1 | TSPAN11 | 0.816376 | 3 | 0 | 3 |
| GH1 | SLC22A31 | 0.816146 | 3 | 0 | 3 |
| GH1 | NKX6-3 | 0.799727 | 3 | 0 | 3 |
| GH1 | DCDC1 | 0.787821 | 3 | 0 | 3 |
| GH1 | CLCNKB | 0.78616 | 3 | 0 | 3 |
| GH1 | PLA2G2C | 0.779366 | 3 | 0 | 3 |
| GH1 | C1QL2 | 0.774647 | 3 | 0 | 3 |
| GH1 | C9orf153 | 0.773221 | 3 | 0 | 3 |
| GH1 | C2CD4D | 0.771542 | 3 | 0 | 3 |
| GH1 | TUBA3D | 0.765541 | 3 | 0 | 3 |
| GH1 | SLC6A18 | 0.763896 | 3 | 0 | 3 |
| GH1 | YY2 | 0.763576 | 3 | 0 | 3 |
| GH1 | PIP5KL1 | 0.759935 | 3 | 0 | 3 |
| GH1 | PNPLA7 | 0.758042 | 3 | 0 | 3 |
| GH1 | NTNG2 | 0.756767 | 3 | 0 | 3 |
| GH1 | QRFP | 0.75413 | 3 | 0 | 3 |
| GH1 | MEGF11 | 0.752292 | 3 | 0 | 3 |
For details and further investigation, click here