| Full name: GDNF family receptor alpha 1 | Alias Symbol: RETL1|GDNFR|GFR-ALPHA-1|RET1L|TRNR1 | ||
| Type: protein-coding gene | Cytoband: 10q25.3 | ||
| Entrez ID: 2674 | HGNC ID: HGNC:4243 | Ensembl Gene: ENSG00000151892 | OMIM ID: 601496 |
| Drug and gene relationship at DGIdb | |||
Expression of GFRA1:
| Dataset | Gene | EntrezID | Probe | Log2FC | Adj.pValue | Expression |
|---|---|---|---|---|---|---|
| GSE17351 | GFRA1 | 2674 | 227550_at | -1.6379 | 0.0250 | |
| GSE20347 | GFRA1 | 2674 | 205696_s_at | 0.2079 | 0.3550 | |
| GSE23400 | GFRA1 | 2674 | 205696_s_at | -0.0185 | 0.3880 | |
| GSE26886 | GFRA1 | 2674 | 227550_at | -0.1360 | 0.7617 | |
| GSE29001 | GFRA1 | 2674 | 205696_s_at | 0.0413 | 0.8299 | |
| GSE38129 | GFRA1 | 2674 | 205696_s_at | -0.0313 | 0.8550 | |
| GSE45670 | GFRA1 | 2674 | 227550_at | -2.4958 | 0.0000 | |
| GSE53622 | GFRA1 | 2674 | 94944 | -1.9727 | 0.0000 | |
| GSE53624 | GFRA1 | 2674 | 32777 | -1.8907 | 0.0000 | |
| GSE63941 | GFRA1 | 2674 | 227550_at | -2.5519 | 0.0002 | |
| GSE77861 | GFRA1 | 2674 | 227550_at | -0.0677 | 0.6541 | |
| GSE97050 | GFRA1 | 2674 | A_33_P3639068 | -0.6188 | 0.1520 | |
| SRP064894 | GFRA1 | 2674 | RNAseq | -1.8287 | 0.0001 | |
| SRP133303 | GFRA1 | 2674 | RNAseq | -3.0764 | 0.0000 | |
| SRP193095 | GFRA1 | 2674 | RNAseq | -0.6245 | 0.1407 | |
| SRP219564 | GFRA1 | 2674 | RNAseq | -1.1806 | 0.2822 | |
| TCGA | GFRA1 | 2674 | RNAseq | -1.4438 | 0.0000 |
Upregulated datasets: 0; Downregulated datasets: 8.
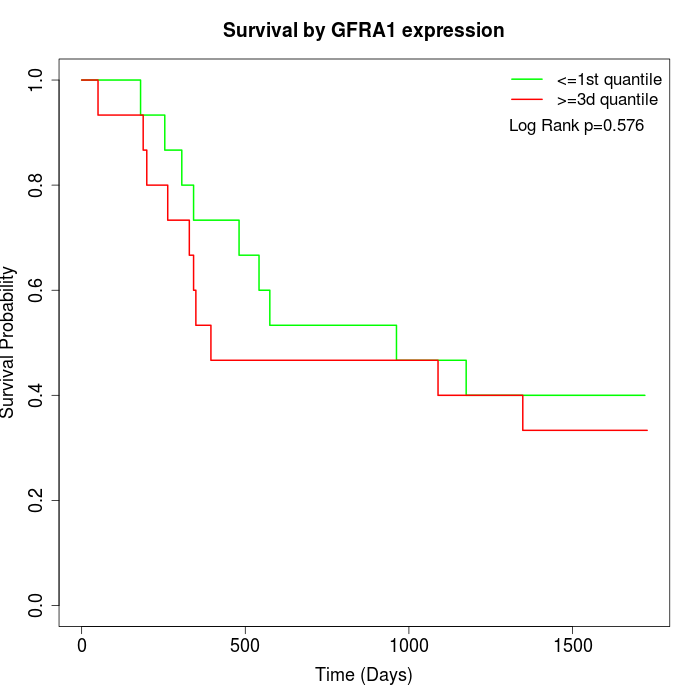
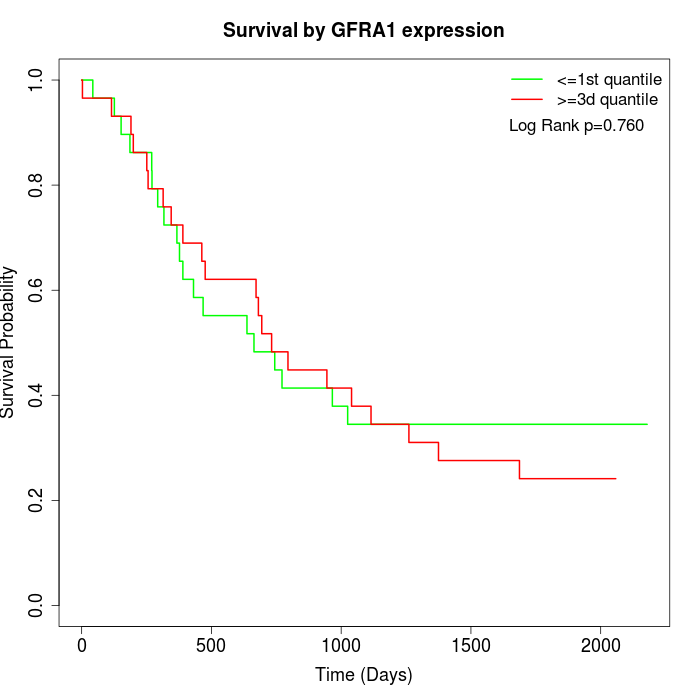
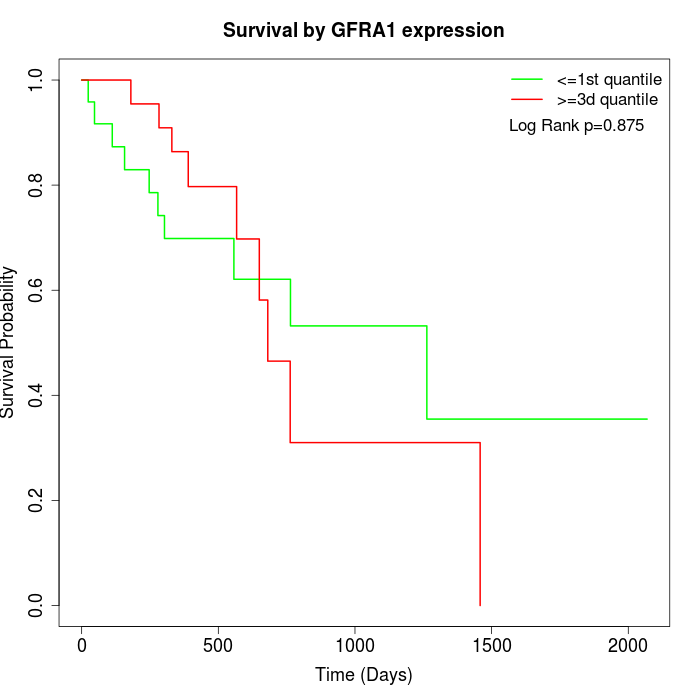
Survival by GFRA1 expression:
Note: Click image to view full size file.
Copy number change of GFRA1:
| Dataset | Gene | EntrezID | Gain | Loss | Normal | Detail |
|---|---|---|---|---|---|---|
| GSE15526 | GFRA1 | 2674 | 1 | 8 | 21 | |
| GSE20123 | GFRA1 | 2674 | 1 | 7 | 22 | |
| GSE43470 | GFRA1 | 2674 | 0 | 9 | 34 | |
| GSE46452 | GFRA1 | 2674 | 0 | 11 | 48 | |
| GSE47630 | GFRA1 | 2674 | 2 | 14 | 24 | |
| GSE54993 | GFRA1 | 2674 | 8 | 0 | 62 | |
| GSE54994 | GFRA1 | 2674 | 1 | 9 | 43 | |
| GSE60625 | GFRA1 | 2674 | 0 | 0 | 11 | |
| GSE74703 | GFRA1 | 2674 | 0 | 6 | 30 | |
| GSE74704 | GFRA1 | 2674 | 1 | 3 | 16 | |
| TCGA | GFRA1 | 2674 | 4 | 28 | 64 |
Total number of gains: 18; Total number of losses: 95; Total Number of normals: 375.
Somatic mutations of GFRA1:
Generating mutation plots.
Highly correlated genes for GFRA1:
Showing top 20/1274 corelated genes with mean PCC>0.5.
| Gene1 | Gene2 | Mean PCC | Num. Datasets | Num. PCC<0 | Num. PCC>0.5 |
|---|---|---|---|---|---|
| GFRA1 | NPY1R | 0.902899 | 3 | 0 | 3 |
| GFRA1 | HOXA4 | 0.863784 | 3 | 0 | 3 |
| GFRA1 | TBX5-AS1 | 0.860221 | 3 | 0 | 3 |
| GFRA1 | FIBIN | 0.846696 | 4 | 0 | 4 |
| GFRA1 | LINC01082 | 0.834829 | 5 | 0 | 5 |
| GFRA1 | RCAN2 | 0.833087 | 7 | 0 | 7 |
| GFRA1 | PDE5A | 0.831635 | 7 | 0 | 7 |
| GFRA1 | C7 | 0.826637 | 6 | 0 | 6 |
| GFRA1 | TMEM100 | 0.82069 | 6 | 0 | 6 |
| GFRA1 | F10 | 0.820242 | 6 | 0 | 6 |
| GFRA1 | MAGI2-AS3 | 0.814543 | 5 | 0 | 5 |
| GFRA1 | ANK2 | 0.812969 | 6 | 0 | 6 |
| GFRA1 | PCP4 | 0.811915 | 5 | 0 | 5 |
| GFRA1 | TIMP3 | 0.810135 | 4 | 0 | 4 |
| GFRA1 | PITPNM2 | 0.803645 | 3 | 0 | 3 |
| GFRA1 | CASQ2 | 0.800986 | 6 | 0 | 6 |
| GFRA1 | TGFBR3 | 0.799689 | 6 | 0 | 6 |
| GFRA1 | PGM5-AS1 | 0.798028 | 3 | 0 | 3 |
| GFRA1 | METTL7A | 0.793211 | 5 | 0 | 5 |
| GFRA1 | EIF4E3 | 0.792614 | 5 | 0 | 5 |
For details and further investigation, click here


