| Full name: integrin subunit alpha 10 | Alias Symbol: | ||
| Type: protein-coding gene | Cytoband: 1q21.1 | ||
| Entrez ID: 8515 | HGNC ID: HGNC:6135 | Ensembl Gene: ENSG00000143127 | OMIM ID: 604042 |
ITGA10 involved pathways:
| KEGG pathway | Description | View |
|---|---|---|
| hsa04151 | PI3K-Akt signaling pathway | |
| hsa04510 | Focal adhesion | |
| hsa04810 | Regulation of actin cytoskeleton |
Expression of ITGA10:
| Dataset | Gene | EntrezID | Probe | Log2FC | Adj.pValue | Expression |
|---|---|---|---|---|---|---|
| GSE17351 | ITGA10 | 8515 | 206766_at | -0.2106 | 0.3042 | |
| GSE20347 | ITGA10 | 8515 | 206766_at | -0.1398 | 0.1632 | |
| GSE23400 | ITGA10 | 8515 | 206766_at | -0.1391 | 0.0000 | |
| GSE26886 | ITGA10 | 8515 | 206766_at | -0.1325 | 0.3034 | |
| GSE29001 | ITGA10 | 8515 | 206766_at | -0.2498 | 0.0979 | |
| GSE38129 | ITGA10 | 8515 | 206766_at | -0.2255 | 0.0090 | |
| GSE45670 | ITGA10 | 8515 | 206766_at | -0.3821 | 0.0140 | |
| GSE53622 | ITGA10 | 8515 | 35242 | -0.3932 | 0.0018 | |
| GSE53624 | ITGA10 | 8515 | 35091 | -0.2935 | 0.0000 | |
| GSE63941 | ITGA10 | 8515 | 206766_at | -0.1550 | 0.4444 | |
| GSE77861 | ITGA10 | 8515 | 206766_at | -0.0813 | 0.5198 | |
| GSE97050 | ITGA10 | 8515 | A_33_P3263432 | -0.0594 | 0.8071 | |
| SRP064894 | ITGA10 | 8515 | RNAseq | -0.3740 | 0.2812 | |
| SRP133303 | ITGA10 | 8515 | RNAseq | -0.8296 | 0.0533 | |
| SRP159526 | ITGA10 | 8515 | RNAseq | 0.0336 | 0.9466 | |
| SRP193095 | ITGA10 | 8515 | RNAseq | -0.6557 | 0.0002 | |
| SRP219564 | ITGA10 | 8515 | RNAseq | 0.4630 | 0.5887 | |
| TCGA | ITGA10 | 8515 | RNAseq | -1.0254 | 0.0000 |
Upregulated datasets: 0; Downregulated datasets: 1.
Survival by ITGA10 expression:
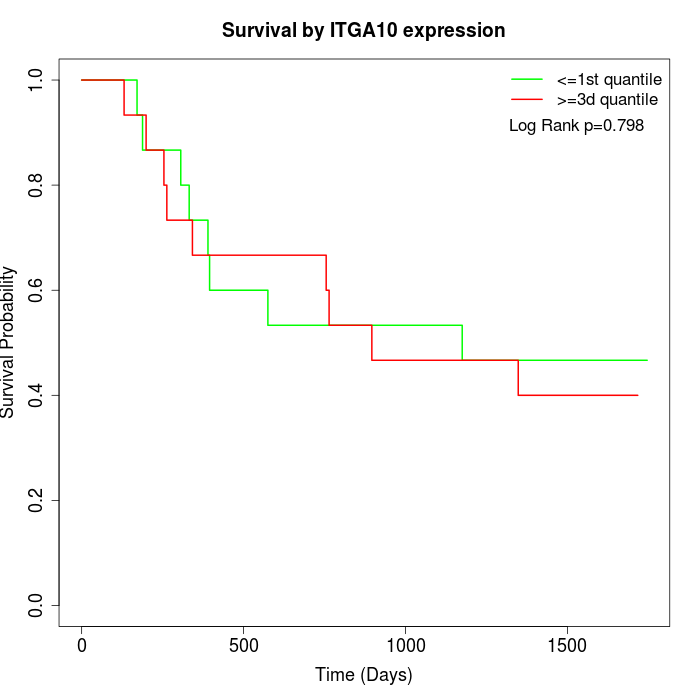 | 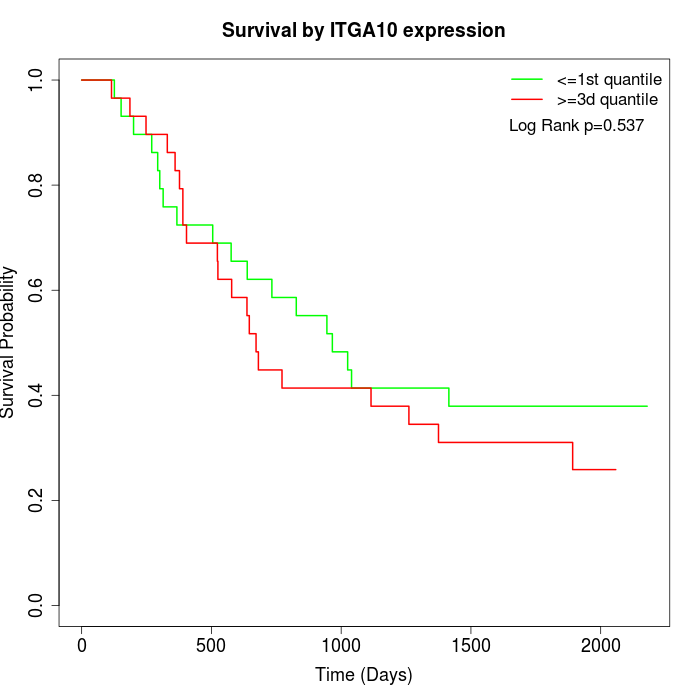 | 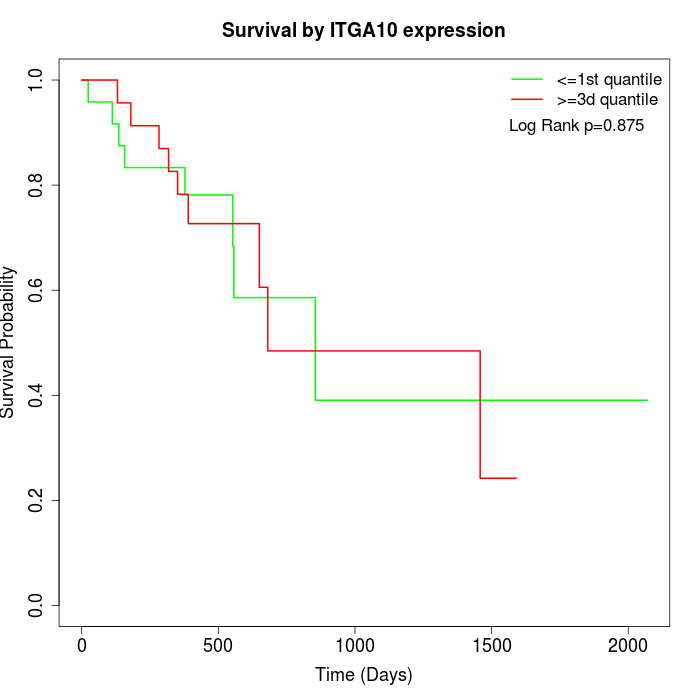 |
| GSE53622 | GSE53624 | TCGA |
Note: Click image to view full size file.
Copy number change of ITGA10:
| Dataset | Gene | EntrezID | Gain | Loss | Normal | Detail |
|---|---|---|---|---|---|---|
| GSE15526 | ITGA10 | 8515 | 13 | 0 | 17 | |
| GSE20123 | ITGA10 | 8515 | 13 | 0 | 17 | |
| GSE43470 | ITGA10 | 8515 | 5 | 1 | 37 | |
| GSE46452 | ITGA10 | 8515 | 2 | 1 | 56 | |
| GSE47630 | ITGA10 | 8515 | 12 | 2 | 26 | |
| GSE54993 | ITGA10 | 8515 | 0 | 2 | 68 | |
| GSE54994 | ITGA10 | 8515 | 15 | 0 | 38 | |
| GSE60625 | ITGA10 | 8515 | 0 | 0 | 11 | |
| GSE74703 | ITGA10 | 8515 | 5 | 1 | 30 | |
| GSE74704 | ITGA10 | 8515 | 6 | 0 | 14 | |
| TCGA | ITGA10 | 8515 | 33 | 15 | 48 |
Total number of gains: 104; Total number of losses: 22; Total Number of normals: 362.
Somatic mutations of ITGA10:
Generating mutation plots.
Highly correlated genes for ITGA10:
Showing top 20/678 corelated genes with mean PCC>0.5.
| Gene1 | Gene2 | Mean PCC | Num. Datasets | Num. PCC<0 | Num. PCC>0.5 |
|---|---|---|---|---|---|
| ITGA10 | GPR146 | 0.796859 | 3 | 0 | 3 |
| ITGA10 | ADAP1 | 0.767947 | 3 | 0 | 3 |
| ITGA10 | ACRV1 | 0.718599 | 6 | 0 | 6 |
| ITGA10 | LY6H | 0.717236 | 3 | 0 | 3 |
| ITGA10 | CYP11B1 | 0.715679 | 6 | 0 | 5 |
| ITGA10 | CNR2 | 0.707911 | 6 | 0 | 6 |
| ITGA10 | INHBC | 0.707239 | 3 | 0 | 3 |
| ITGA10 | PSG1 | 0.706086 | 6 | 0 | 6 |
| ITGA10 | PCBP4 | 0.702127 | 3 | 0 | 3 |
| ITGA10 | ASB10 | 0.699826 | 3 | 0 | 3 |
| ITGA10 | HTR1E | 0.698252 | 5 | 0 | 4 |
| ITGA10 | VSTM2A | 0.696263 | 3 | 0 | 3 |
| ITGA10 | S100A5 | 0.692665 | 4 | 0 | 3 |
| ITGA10 | SIGLEC7 | 0.691635 | 5 | 0 | 4 |
| ITGA10 | CYP2A7 | 0.688215 | 7 | 0 | 6 |
| ITGA10 | WDR87 | 0.683466 | 4 | 0 | 3 |
| ITGA10 | EPB42 | 0.683396 | 6 | 0 | 5 |
| ITGA10 | GPR50 | 0.683395 | 5 | 0 | 5 |
| ITGA10 | TEK | 0.683217 | 4 | 0 | 3 |
| ITGA10 | PGLYRP1 | 0.682671 | 5 | 0 | 5 |
For details and further investigation, click here