| Full name: cytochrome P450 family 26 subfamily A member 1 | Alias Symbol: P450RAI|CP26|CYP26|P450RAI1 | ||
| Type: protein-coding gene | Cytoband: 10q23.33 | ||
| Entrez ID: 1592 | HGNC ID: HGNC:2603 | Ensembl Gene: ENSG00000095596 | OMIM ID: 602239 |
| Related drugs: LIAROZOLE, TALAROZOLE... [more] | |||
Expression of CYP26A1:
| Dataset | Gene | EntrezID | Probe | Log2FC | Adj.pValue | Expression |
|---|---|---|---|---|---|---|
| GSE17351 | CYP26A1 | 1592 | 206424_at | 0.9552 | 0.4691 | |
| GSE20347 | CYP26A1 | 1592 | 206424_at | 0.9763 | 0.0031 | |
| GSE23400 | CYP26A1 | 1592 | 206424_at | 0.2862 | 0.0177 | |
| GSE26886 | CYP26A1 | 1592 | 206424_at | 0.9122 | 0.0153 | |
| GSE29001 | CYP26A1 | 1592 | 206424_at | 0.8928 | 0.0941 | |
| GSE38129 | CYP26A1 | 1592 | 206424_at | 1.1459 | 0.0001 | |
| GSE45670 | CYP26A1 | 1592 | 206424_at | 0.7430 | 0.1726 | |
| GSE53622 | CYP26A1 | 1592 | 99366 | 2.4050 | 0.0000 | |
| GSE53624 | CYP26A1 | 1592 | 99366 | 3.1376 | 0.0000 | |
| GSE63941 | CYP26A1 | 1592 | 206424_at | 1.7361 | 0.1400 | |
| GSE77861 | CYP26A1 | 1592 | 206424_at | 1.5610 | 0.0180 | |
| SRP159526 | CYP26A1 | 1592 | RNAseq | 8.1161 | 0.0000 | |
| TCGA | CYP26A1 | 1592 | RNAseq | 1.7140 | 0.0291 |
Upregulated datasets: 6; Downregulated datasets: 0.
Survival by CYP26A1 expression:
 | 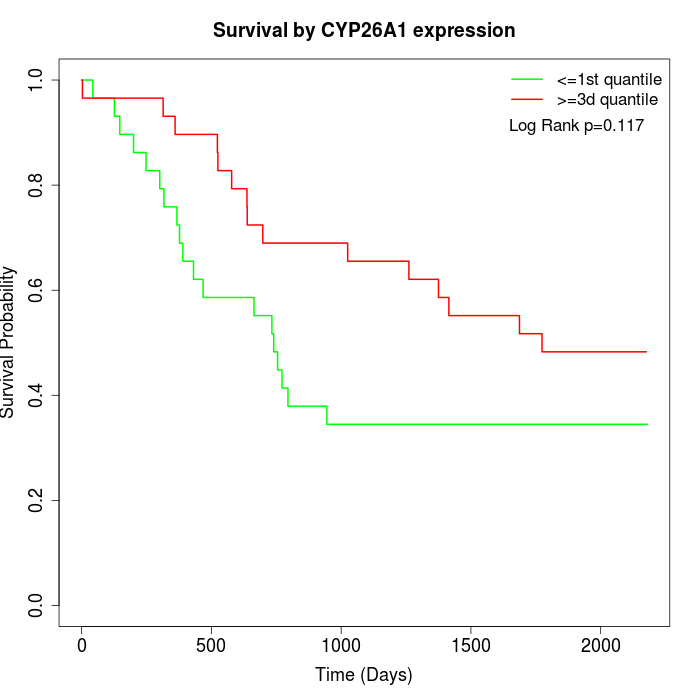 | 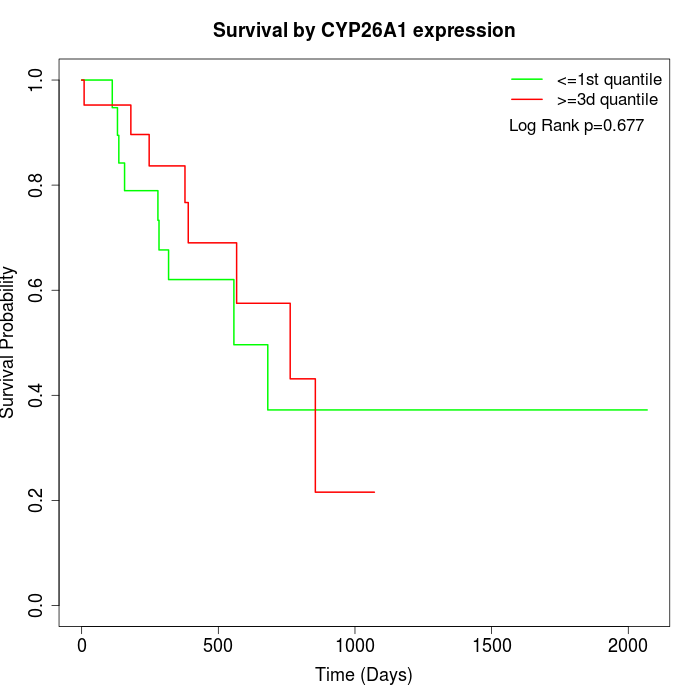 |
| GSE53622 | GSE53624 | TCGA |
Note: Click image to view full size file.
Copy number change of CYP26A1:
| Dataset | Gene | EntrezID | Gain | Loss | Normal | Detail |
|---|---|---|---|---|---|---|
| GSE15526 | CYP26A1 | 1592 | 2 | 7 | 21 | |
| GSE20123 | CYP26A1 | 1592 | 2 | 6 | 22 | |
| GSE43470 | CYP26A1 | 1592 | 0 | 8 | 35 | |
| GSE46452 | CYP26A1 | 1592 | 1 | 11 | 47 | |
| GSE47630 | CYP26A1 | 1592 | 2 | 14 | 24 | |
| GSE54993 | CYP26A1 | 1592 | 7 | 0 | 63 | |
| GSE54994 | CYP26A1 | 1592 | 1 | 10 | 42 | |
| GSE60625 | CYP26A1 | 1592 | 0 | 0 | 11 | |
| GSE74703 | CYP26A1 | 1592 | 0 | 6 | 30 | |
| GSE74704 | CYP26A1 | 1592 | 0 | 4 | 16 | |
| TCGA | CYP26A1 | 1592 | 7 | 27 | 62 |
Total number of gains: 22; Total number of losses: 93; Total Number of normals: 373.
Somatic mutations of CYP26A1:
Generating mutation plots.
Highly correlated genes for CYP26A1:
Showing top 20/191 corelated genes with mean PCC>0.5.
| Gene1 | Gene2 | Mean PCC | Num. Datasets | Num. PCC<0 | Num. PCC>0.5 |
|---|---|---|---|---|---|
| CYP26A1 | SOX2-OT | 0.75604 | 6 | 0 | 6 |
| CYP26A1 | AQP10 | 0.707229 | 3 | 0 | 3 |
| CYP26A1 | CHRM3 | 0.657474 | 4 | 0 | 4 |
| CYP26A1 | OLFM1 | 0.643754 | 3 | 0 | 3 |
| CYP26A1 | NRCAM | 0.643643 | 11 | 0 | 10 |
| CYP26A1 | PIPOX | 0.640846 | 3 | 0 | 3 |
| CYP26A1 | TMEM116 | 0.636652 | 7 | 0 | 7 |
| CYP26A1 | MIEN1 | 0.623949 | 4 | 0 | 3 |
| CYP26A1 | CHST7 | 0.620648 | 11 | 0 | 8 |
| CYP26A1 | ABCC5 | 0.620231 | 12 | 0 | 10 |
| CYP26A1 | HEY1 | 0.61654 | 12 | 0 | 10 |
| CYP26A1 | NTRK2 | 0.615418 | 11 | 0 | 10 |
| CYP26A1 | PANX2 | 0.613942 | 5 | 0 | 4 |
| CYP26A1 | MRAP2 | 0.611886 | 7 | 0 | 5 |
| CYP26A1 | SCN9A | 0.61142 | 11 | 0 | 8 |
| CYP26A1 | SLC35G1 | 0.611191 | 5 | 0 | 4 |
| CYP26A1 | ZNF275 | 0.610439 | 5 | 0 | 4 |
| CYP26A1 | WDR81 | 0.604029 | 3 | 0 | 3 |
| CYP26A1 | FGFBP2 | 0.600706 | 7 | 0 | 5 |
| CYP26A1 | FREM2 | 0.600472 | 7 | 0 | 3 |
For details and further investigation, click here