| Full name: enolase superfamily member 1 | Alias Symbol: HSRTSBETA|rTS|TYMSAS|FUCD | ||
| Type: protein-coding gene | Cytoband: 18p11.32 | ||
| Entrez ID: 55556 | HGNC ID: HGNC:30365 | Ensembl Gene: ENSG00000132199 | OMIM ID: 607427 |
| Related drugs: LAMIVUDINE, ZIDOVUDINE... [more] | |||
Expression of ENOSF1:
| Dataset | Gene | EntrezID | Probe | Log2FC | Adj.pValue | Expression |
|---|---|---|---|---|---|---|
| GSE17351 | ENOSF1 | 55556 | 204143_s_at | -0.3958 | 0.6846 | |
| GSE20347 | ENOSF1 | 55556 | 204142_at | -0.2755 | 0.0636 | |
| GSE23400 | ENOSF1 | 55556 | 204143_s_at | -0.0779 | 0.4742 | |
| GSE26886 | ENOSF1 | 55556 | 204142_at | -0.2685 | 0.3920 | |
| GSE29001 | ENOSF1 | 55556 | 204142_at | -0.2963 | 0.3193 | |
| GSE38129 | ENOSF1 | 55556 | 204142_at | -0.2613 | 0.2091 | |
| GSE45670 | ENOSF1 | 55556 | 204142_at | 0.2995 | 0.2027 | |
| GSE53622 | ENOSF1 | 55556 | 46805 | -0.0820 | 0.4101 | |
| GSE53624 | ENOSF1 | 55556 | 46805 | -0.2809 | 0.0002 | |
| GSE63941 | ENOSF1 | 55556 | 204142_at | 1.0660 | 0.2440 | |
| GSE77861 | ENOSF1 | 55556 | 204142_at | -0.0092 | 0.9859 | |
| GSE97050 | ENOSF1 | 55556 | A_33_P3261902 | -0.5182 | 0.1834 | |
| SRP007169 | ENOSF1 | 55556 | RNAseq | 0.0707 | 0.8786 | |
| SRP008496 | ENOSF1 | 55556 | RNAseq | -0.1796 | 0.5483 | |
| SRP064894 | ENOSF1 | 55556 | RNAseq | 0.3805 | 0.2338 | |
| SRP133303 | ENOSF1 | 55556 | RNAseq | -0.2922 | 0.0137 | |
| SRP159526 | ENOSF1 | 55556 | RNAseq | -0.2600 | 0.3989 | |
| SRP193095 | ENOSF1 | 55556 | RNAseq | -0.0501 | 0.7440 | |
| SRP219564 | ENOSF1 | 55556 | RNAseq | -0.2137 | 0.5273 | |
| TCGA | ENOSF1 | 55556 | RNAseq | -0.1393 | 0.0589 |
Upregulated datasets: 0; Downregulated datasets: 0.
Survival by ENOSF1 expression:
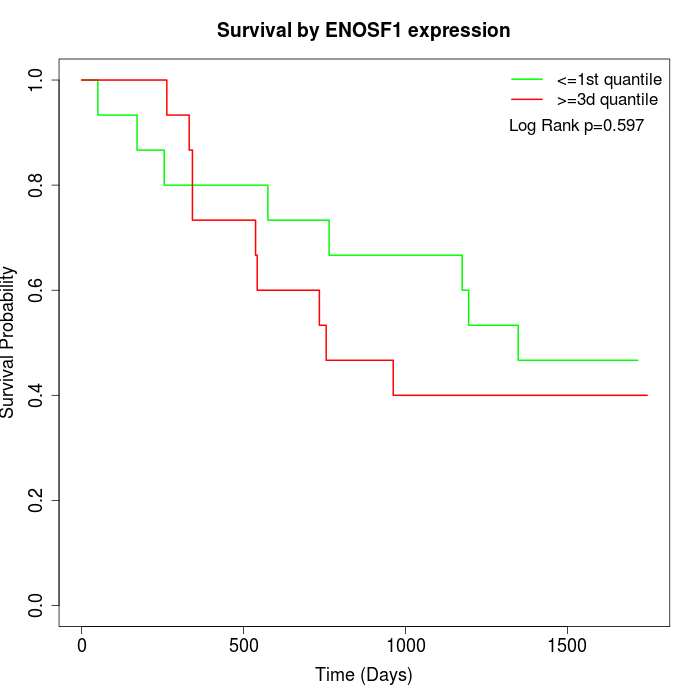 | 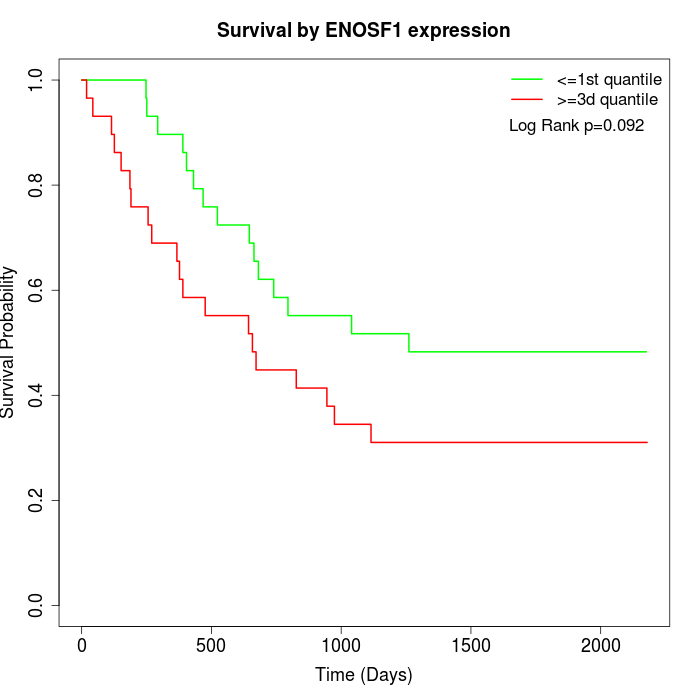 | 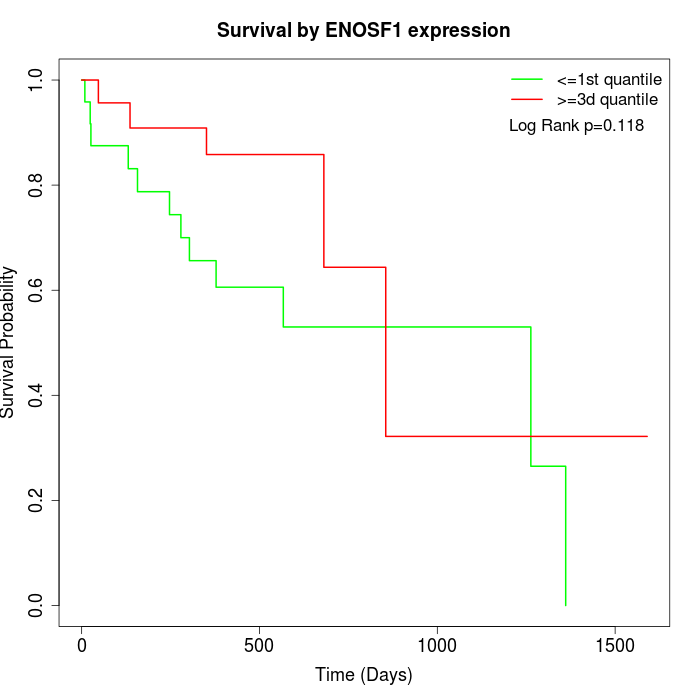 |
| GSE53622 | GSE53624 | TCGA |
Note: Click image to view full size file.
Copy number change of ENOSF1:
| Dataset | Gene | EntrezID | Gain | Loss | Normal | Detail |
|---|---|---|---|---|---|---|
| GSE15526 | ENOSF1 | 55556 | 6 | 3 | 21 | |
| GSE20123 | ENOSF1 | 55556 | 6 | 3 | 21 | |
| GSE43470 | ENOSF1 | 55556 | 2 | 4 | 37 | |
| GSE46452 | ENOSF1 | 55556 | 4 | 20 | 35 | |
| GSE47630 | ENOSF1 | 55556 | 7 | 18 | 15 | |
| GSE54993 | ENOSF1 | 55556 | 6 | 3 | 61 | |
| GSE54994 | ENOSF1 | 55556 | 11 | 8 | 34 | |
| GSE60625 | ENOSF1 | 55556 | 0 | 4 | 7 | |
| GSE74703 | ENOSF1 | 55556 | 2 | 2 | 32 | |
| GSE74704 | ENOSF1 | 55556 | 4 | 2 | 14 | |
| TCGA | ENOSF1 | 55556 | 35 | 18 | 43 |
Total number of gains: 83; Total number of losses: 85; Total Number of normals: 320.
Somatic mutations of ENOSF1:
Generating mutation plots.
Highly correlated genes for ENOSF1:
Showing top 20/162 corelated genes with mean PCC>0.5.
| Gene1 | Gene2 | Mean PCC | Num. Datasets | Num. PCC<0 | Num. PCC>0.5 |
|---|---|---|---|---|---|
| ENOSF1 | CAPN3 | 0.834109 | 3 | 0 | 3 |
| ENOSF1 | TDRD3 | 0.796889 | 3 | 0 | 3 |
| ENOSF1 | KCTD21 | 0.788902 | 3 | 0 | 3 |
| ENOSF1 | ACP6 | 0.77812 | 3 | 0 | 3 |
| ENOSF1 | NUDCD3 | 0.776655 | 3 | 0 | 3 |
| ENOSF1 | HAUS2 | 0.766596 | 3 | 0 | 3 |
| ENOSF1 | MRPL52 | 0.761173 | 3 | 0 | 3 |
| ENOSF1 | ZNF345 | 0.748647 | 3 | 0 | 3 |
| ENOSF1 | LYPLAL1 | 0.726314 | 3 | 0 | 3 |
| ENOSF1 | ANO8 | 0.723871 | 3 | 0 | 3 |
| ENOSF1 | ATP7A | 0.72279 | 4 | 0 | 3 |
| ENOSF1 | CIDEB | 0.714441 | 4 | 0 | 4 |
| ENOSF1 | SPAG7 | 0.714099 | 3 | 0 | 3 |
| ENOSF1 | TADA2B | 0.710191 | 3 | 0 | 3 |
| ENOSF1 | MTCP1 | 0.70917 | 3 | 0 | 3 |
| ENOSF1 | ABHD6 | 0.698971 | 3 | 0 | 3 |
| ENOSF1 | UTP3 | 0.698071 | 3 | 0 | 3 |
| ENOSF1 | WDFY2 | 0.694352 | 3 | 0 | 3 |
| ENOSF1 | UBXN4 | 0.691533 | 3 | 0 | 3 |
| ENOSF1 | FRAS1 | 0.691196 | 3 | 0 | 3 |
For details and further investigation, click here