| Full name: Fraser extracellular matrix complex subunit 1 | Alias Symbol: FLJ22031|FLJ14927|KIAA1500 | ||
| Type: protein-coding gene | Cytoband: 4q21.21 | ||
| Entrez ID: 80144 | HGNC ID: HGNC:19185 | Ensembl Gene: ENSG00000138759 | OMIM ID: 607830 |
Expression of FRAS1:
| Dataset | Gene | EntrezID | Probe | Log2FC | Adj.pValue | Expression |
|---|---|---|---|---|---|---|
| GSE17351 | FRAS1 | 80144 | 226145_s_at | -1.5546 | 0.1704 | |
| GSE20347 | FRAS1 | 80144 | 220910_at | -0.0266 | 0.7824 | |
| GSE23400 | FRAS1 | 80144 | 220910_at | -0.1273 | 0.0075 | |
| GSE26886 | FRAS1 | 80144 | 226145_s_at | 0.2692 | 0.6607 | |
| GSE29001 | FRAS1 | 80144 | 220910_at | -0.2213 | 0.3002 | |
| GSE38129 | FRAS1 | 80144 | 220910_at | -0.1350 | 0.1061 | |
| GSE45670 | FRAS1 | 80144 | 226145_s_at | -1.1770 | 0.0247 | |
| GSE53622 | FRAS1 | 80144 | 71189 | -0.9228 | 0.0001 | |
| GSE53624 | FRAS1 | 80144 | 71189 | -0.6769 | 0.0000 | |
| GSE63941 | FRAS1 | 80144 | 226145_s_at | 1.1910 | 0.4296 | |
| GSE77861 | FRAS1 | 80144 | 226145_s_at | -0.2325 | 0.8381 | |
| GSE97050 | FRAS1 | 80144 | A_33_P3380647 | -0.4628 | 0.2904 | |
| SRP007169 | FRAS1 | 80144 | RNAseq | 1.7833 | 0.0018 | |
| SRP008496 | FRAS1 | 80144 | RNAseq | 2.0766 | 0.0000 | |
| SRP064894 | FRAS1 | 80144 | RNAseq | -0.3875 | 0.3136 | |
| SRP133303 | FRAS1 | 80144 | RNAseq | -0.4533 | 0.3375 | |
| SRP159526 | FRAS1 | 80144 | RNAseq | 0.0944 | 0.8740 | |
| SRP193095 | FRAS1 | 80144 | RNAseq | -0.1311 | 0.7232 | |
| SRP219564 | FRAS1 | 80144 | RNAseq | -0.4172 | 0.6129 | |
| TCGA | FRAS1 | 80144 | RNAseq | -0.0853 | 0.7411 |
Upregulated datasets: 2; Downregulated datasets: 1.
Survival by FRAS1 expression:
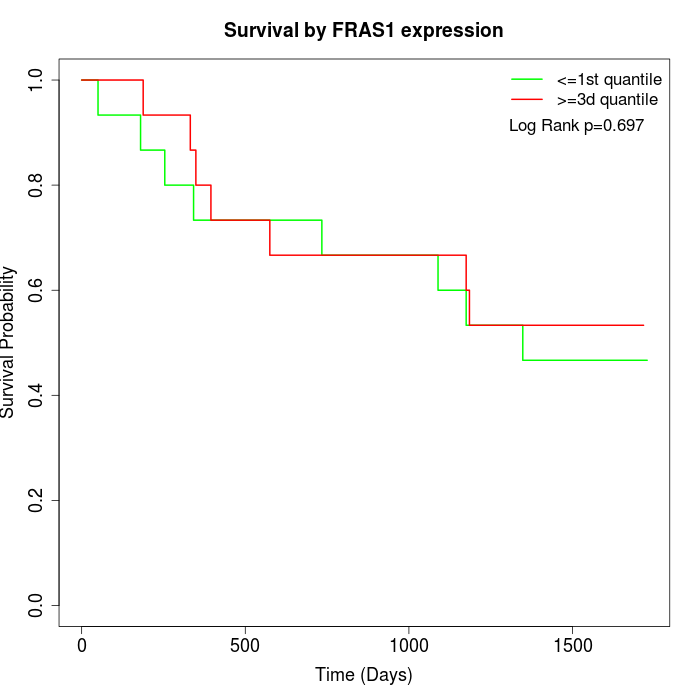 | 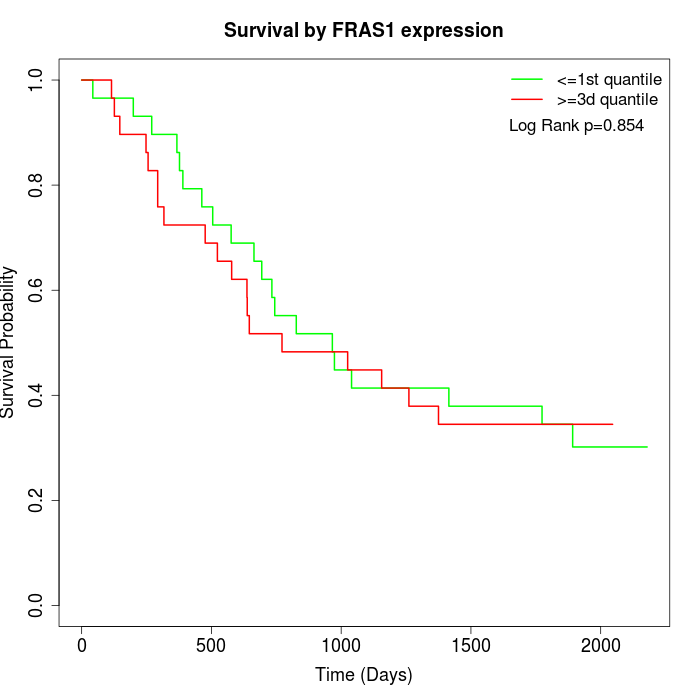 | 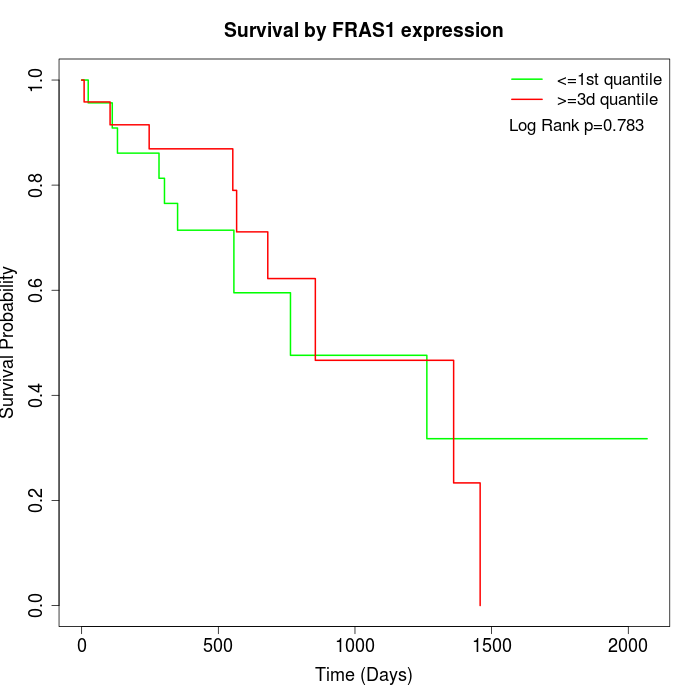 |
| GSE53622 | GSE53624 | TCGA |
Note: Click image to view full size file.
Copy number change of FRAS1:
| Dataset | Gene | EntrezID | Gain | Loss | Normal | Detail |
|---|---|---|---|---|---|---|
| GSE15526 | FRAS1 | 80144 | 1 | 10 | 19 | |
| GSE20123 | FRAS1 | 80144 | 1 | 10 | 19 | |
| GSE43470 | FRAS1 | 80144 | 1 | 12 | 30 | |
| GSE46452 | FRAS1 | 80144 | 1 | 36 | 22 | |
| GSE47630 | FRAS1 | 80144 | 1 | 19 | 20 | |
| GSE54993 | FRAS1 | 80144 | 8 | 0 | 62 | |
| GSE54994 | FRAS1 | 80144 | 0 | 9 | 44 | |
| GSE60625 | FRAS1 | 80144 | 0 | 0 | 11 | |
| GSE74703 | FRAS1 | 80144 | 1 | 10 | 25 | |
| GSE74704 | FRAS1 | 80144 | 1 | 6 | 13 | |
| TCGA | FRAS1 | 80144 | 12 | 33 | 51 |
Total number of gains: 27; Total number of losses: 145; Total Number of normals: 316.
Somatic mutations of FRAS1:
Generating mutation plots.
Highly correlated genes for FRAS1:
Showing top 20/668 corelated genes with mean PCC>0.5.
| Gene1 | Gene2 | Mean PCC | Num. Datasets | Num. PCC<0 | Num. PCC>0.5 |
|---|---|---|---|---|---|
| FRAS1 | MACROD2 | 0.798623 | 3 | 0 | 3 |
| FRAS1 | NCOR1 | 0.795498 | 3 | 0 | 3 |
| FRAS1 | KAT7 | 0.784213 | 3 | 0 | 3 |
| FRAS1 | ABHD14B | 0.775957 | 3 | 0 | 3 |
| FRAS1 | MECP2 | 0.758981 | 3 | 0 | 3 |
| FRAS1 | OPHN1 | 0.756407 | 5 | 0 | 5 |
| FRAS1 | RECK | 0.754737 | 5 | 0 | 5 |
| FRAS1 | TRA2A | 0.754297 | 3 | 0 | 3 |
| FRAS1 | ITGB3 | 0.750927 | 4 | 0 | 4 |
| FRAS1 | C11orf68 | 0.740488 | 3 | 0 | 3 |
| FRAS1 | BMX | 0.737219 | 3 | 0 | 3 |
| FRAS1 | AP3M1 | 0.737024 | 3 | 0 | 3 |
| FRAS1 | RUNX1T1 | 0.736424 | 4 | 0 | 4 |
| FRAS1 | DICER1 | 0.735797 | 3 | 0 | 3 |
| FRAS1 | TRAPPC2 | 0.735494 | 3 | 0 | 3 |
| FRAS1 | TTN | 0.722403 | 4 | 0 | 4 |
| FRAS1 | TCL6 | 0.716618 | 4 | 0 | 4 |
| FRAS1 | ABCC9 | 0.715705 | 3 | 0 | 3 |
| FRAS1 | CER1 | 0.714606 | 5 | 0 | 5 |
| FRAS1 | ASCL3 | 0.711038 | 4 | 0 | 4 |
For details and further investigation, click here