| Full name: glutamyl aminopeptidase | Alias Symbol: gp160|CD249 | ||
| Type: protein-coding gene | Cytoband: 4q25 | ||
| Entrez ID: 2028 | HGNC ID: HGNC:3355 | Ensembl Gene: ENSG00000138792 | OMIM ID: 138297 |
| Related drugs: TOSEDOSTAT... [more] | |||
Expression of ENPEP:
| Dataset | Gene | EntrezID | Probe | Log2FC | Adj.pValue | Expression |
|---|---|---|---|---|---|---|
| GSE17351 | ENPEP | 2028 | 204844_at | 2.0284 | 0.0151 | |
| GSE20347 | ENPEP | 2028 | 204844_at | 0.8843 | 0.0000 | |
| GSE23400 | ENPEP | 2028 | 204844_at | 0.3803 | 0.0000 | |
| GSE26886 | ENPEP | 2028 | 204844_at | 1.9938 | 0.0000 | |
| GSE29001 | ENPEP | 2028 | 204844_at | 0.9424 | 0.0155 | |
| GSE38129 | ENPEP | 2028 | 204844_at | 0.6229 | 0.0124 | |
| GSE45670 | ENPEP | 2028 | 204844_at | 0.3184 | 0.6120 | |
| GSE53622 | ENPEP | 2028 | 13052 | -0.0215 | 0.9134 | |
| GSE53624 | ENPEP | 2028 | 13052 | 0.2680 | 0.2137 | |
| GSE63941 | ENPEP | 2028 | 204844_at | 1.1909 | 0.0684 | |
| GSE77861 | ENPEP | 2028 | 204844_at | 0.4830 | 0.0729 | |
| SRP007169 | ENPEP | 2028 | RNAseq | 3.7776 | 0.0000 | |
| SRP008496 | ENPEP | 2028 | RNAseq | 3.7037 | 0.0000 | |
| SRP064894 | ENPEP | 2028 | RNAseq | 1.6643 | 0.0000 | |
| SRP133303 | ENPEP | 2028 | RNAseq | 1.4811 | 0.0000 | |
| SRP159526 | ENPEP | 2028 | RNAseq | 1.2323 | 0.0010 | |
| SRP193095 | ENPEP | 2028 | RNAseq | 1.7683 | 0.0001 | |
| SRP219564 | ENPEP | 2028 | RNAseq | 0.7896 | 0.2830 | |
| TCGA | ENPEP | 2028 | RNAseq | 0.3577 | 0.0246 |
Upregulated datasets: 8; Downregulated datasets: 0.
Survival by ENPEP expression:
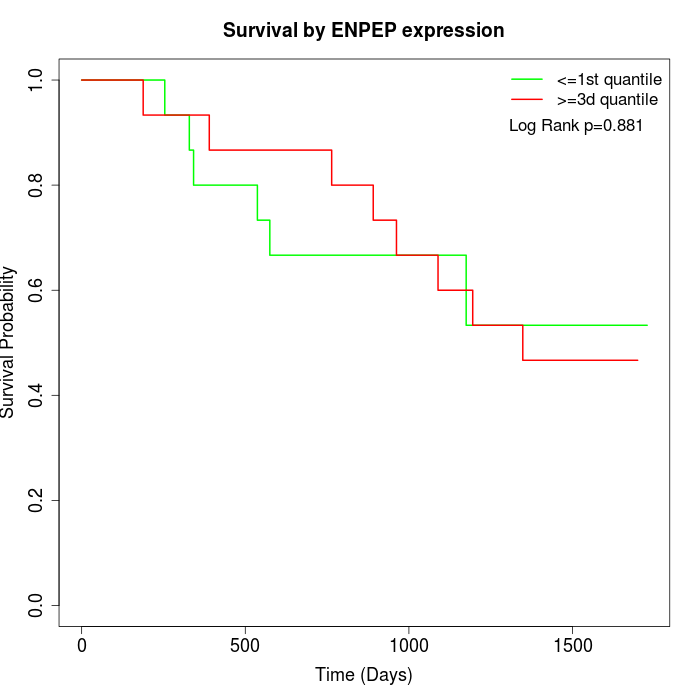 | 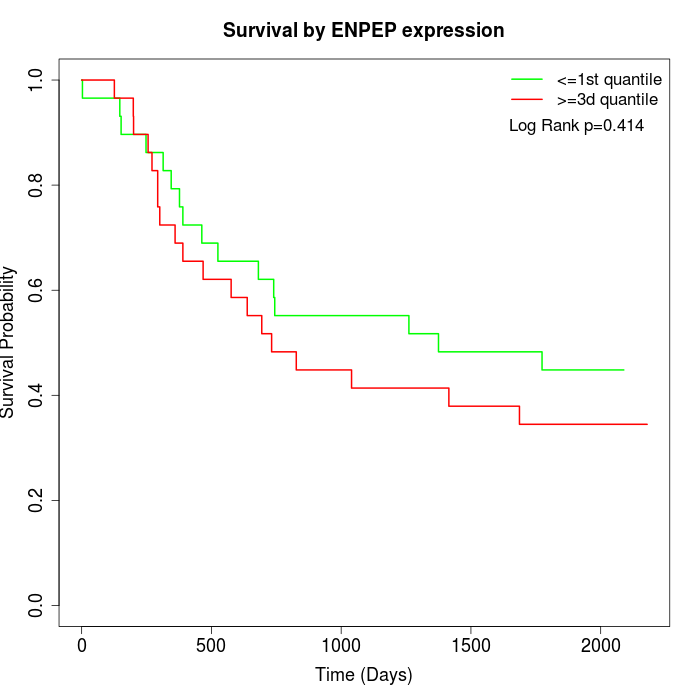 | 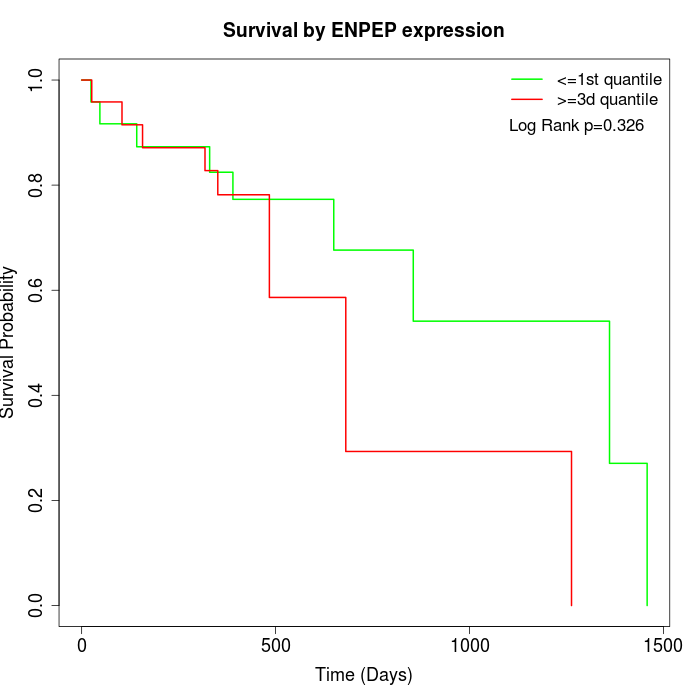 |
| GSE53622 | GSE53624 | TCGA |
Note: Click image to view full size file.
Copy number change of ENPEP:
| Dataset | Gene | EntrezID | Gain | Loss | Normal | Detail |
|---|---|---|---|---|---|---|
| GSE15526 | ENPEP | 2028 | 1 | 13 | 16 | |
| GSE20123 | ENPEP | 2028 | 1 | 13 | 16 | |
| GSE43470 | ENPEP | 2028 | 0 | 14 | 29 | |
| GSE46452 | ENPEP | 2028 | 1 | 36 | 22 | |
| GSE47630 | ENPEP | 2028 | 0 | 20 | 20 | |
| GSE54993 | ENPEP | 2028 | 9 | 0 | 61 | |
| GSE54994 | ENPEP | 2028 | 1 | 11 | 41 | |
| GSE60625 | ENPEP | 2028 | 0 | 3 | 8 | |
| GSE74703 | ENPEP | 2028 | 0 | 12 | 24 | |
| GSE74704 | ENPEP | 2028 | 0 | 7 | 13 | |
| TCGA | ENPEP | 2028 | 8 | 35 | 53 |
Total number of gains: 21; Total number of losses: 164; Total Number of normals: 303.
Somatic mutations of ENPEP:
Generating mutation plots.
Highly correlated genes for ENPEP:
Showing top 20/938 corelated genes with mean PCC>0.5.
| Gene1 | Gene2 | Mean PCC | Num. Datasets | Num. PCC<0 | Num. PCC>0.5 |
|---|---|---|---|---|---|
| ENPEP | MUCL1 | 0.818256 | 3 | 0 | 3 |
| ENPEP | TP53I13 | 0.78055 | 3 | 0 | 3 |
| ENPEP | NOL4L | 0.763936 | 3 | 0 | 3 |
| ENPEP | DHRS13 | 0.739418 | 3 | 0 | 3 |
| ENPEP | CD276 | 0.727047 | 4 | 0 | 4 |
| ENPEP | SLC45A4 | 0.726424 | 3 | 0 | 3 |
| ENPEP | TNFRSF18 | 0.719936 | 3 | 0 | 3 |
| ENPEP | IFT43 | 0.716941 | 4 | 0 | 3 |
| ENPEP | WDR66 | 0.708965 | 4 | 0 | 3 |
| ENPEP | STC2 | 0.704758 | 5 | 0 | 5 |
| ENPEP | FBXL6 | 0.702692 | 3 | 0 | 3 |
| ENPEP | POU6F2-AS2 | 0.702553 | 5 | 0 | 4 |
| ENPEP | TMEM184B | 0.699642 | 7 | 0 | 7 |
| ENPEP | COL27A1 | 0.699611 | 3 | 0 | 3 |
| ENPEP | CA9 | 0.697481 | 4 | 0 | 4 |
| ENPEP | TOP1MT | 0.697057 | 4 | 0 | 3 |
| ENPEP | MFAP2 | 0.690688 | 8 | 0 | 7 |
| ENPEP | PDE7A | 0.690472 | 4 | 0 | 4 |
| ENPEP | GPR84 | 0.68969 | 3 | 0 | 3 |
| ENPEP | TFDP2 | 0.686954 | 3 | 0 | 3 |
For details and further investigation, click here