| Full name: stanniocalcin 2 | Alias Symbol: STC-2 | ||
| Type: protein-coding gene | Cytoband: 5q35.2 | ||
| Entrez ID: 8614 | HGNC ID: HGNC:11374 | Ensembl Gene: ENSG00000113739 | OMIM ID: 603665 |
Expression of STC2:
| Dataset | Gene | EntrezID | Probe | Log2FC | Adj.pValue | Expression |
|---|---|---|---|---|---|---|
| GSE17351 | STC2 | 8614 | 203438_at | 1.5802 | 0.0443 | |
| GSE20347 | STC2 | 8614 | 203438_at | 1.1130 | 0.0000 | |
| GSE23400 | STC2 | 8614 | 203438_at | 0.2476 | 0.0004 | |
| GSE26886 | STC2 | 8614 | 203439_s_at | 1.2378 | 0.0000 | |
| GSE29001 | STC2 | 8614 | 203439_s_at | 2.1074 | 0.0012 | |
| GSE38129 | STC2 | 8614 | 203438_at | 1.1561 | 0.0000 | |
| GSE45670 | STC2 | 8614 | 203439_s_at | 1.1322 | 0.0026 | |
| GSE53622 | STC2 | 8614 | 28676 | 2.3268 | 0.0000 | |
| GSE53624 | STC2 | 8614 | 28676 | 2.9251 | 0.0000 | |
| GSE63941 | STC2 | 8614 | 203438_at | -2.5769 | 0.0671 | |
| GSE77861 | STC2 | 8614 | 203439_s_at | 0.3930 | 0.0912 | |
| GSE97050 | STC2 | 8614 | A_23_P416395 | 0.6486 | 0.1265 | |
| SRP007169 | STC2 | 8614 | RNAseq | 5.9503 | 0.0000 | |
| SRP008496 | STC2 | 8614 | RNAseq | 5.7645 | 0.0000 | |
| SRP064894 | STC2 | 8614 | RNAseq | 3.0430 | 0.0000 | |
| SRP133303 | STC2 | 8614 | RNAseq | 3.4701 | 0.0000 | |
| SRP159526 | STC2 | 8614 | RNAseq | 2.9506 | 0.0000 | |
| SRP219564 | STC2 | 8614 | RNAseq | 1.3666 | 0.0690 | |
| TCGA | STC2 | 8614 | RNAseq | 1.0747 | 0.0000 |
Upregulated datasets: 14; Downregulated datasets: 0.
Survival by STC2 expression:
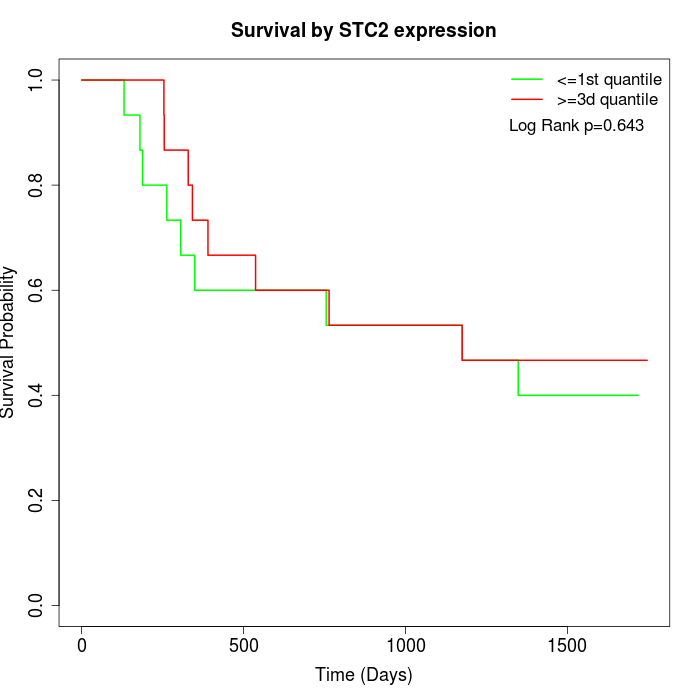 | 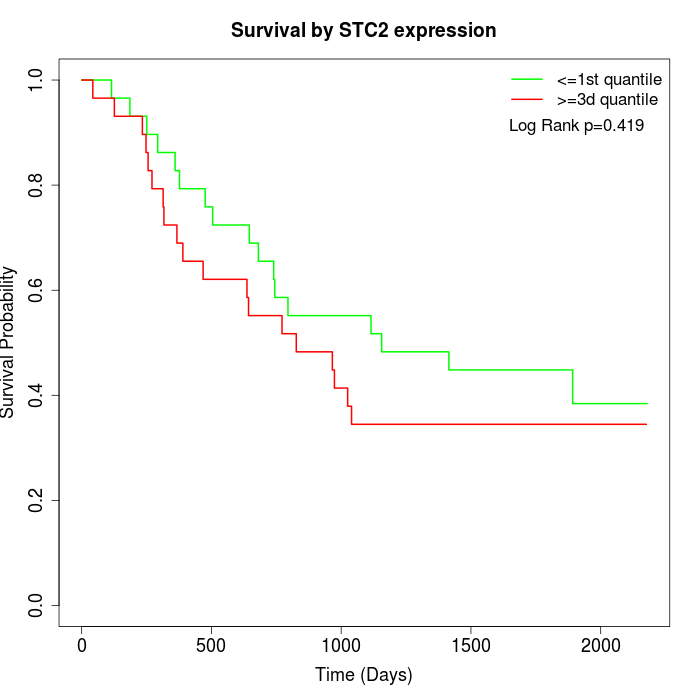 | 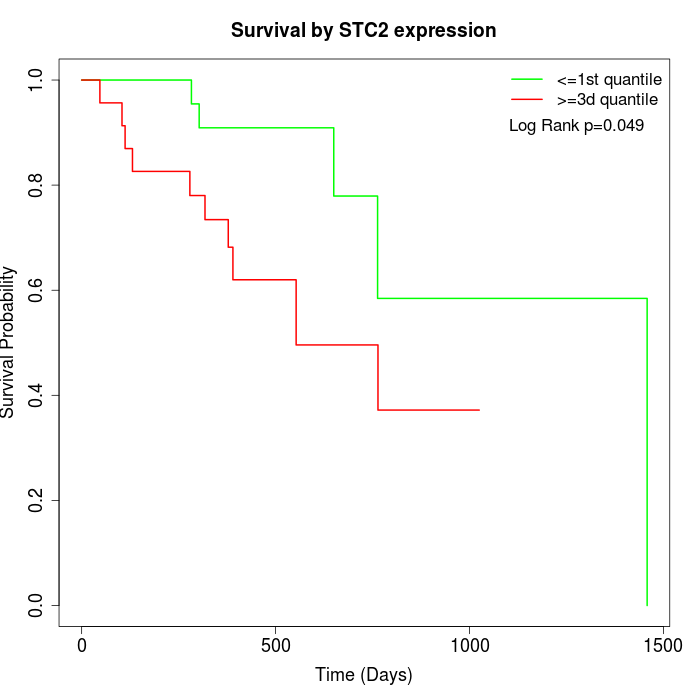 |
| GSE53622 | GSE53624 | TCGA |
Note: Click image to view full size file.
Copy number change of STC2:
| Dataset | Gene | EntrezID | Gain | Loss | Normal | Detail |
|---|---|---|---|---|---|---|
| GSE15526 | STC2 | 8614 | 2 | 13 | 15 | |
| GSE20123 | STC2 | 8614 | 2 | 13 | 15 | |
| GSE43470 | STC2 | 8614 | 2 | 10 | 31 | |
| GSE46452 | STC2 | 8614 | 0 | 27 | 32 | |
| GSE47630 | STC2 | 8614 | 0 | 20 | 20 | |
| GSE54993 | STC2 | 8614 | 9 | 2 | 59 | |
| GSE54994 | STC2 | 8614 | 2 | 17 | 34 | |
| GSE60625 | STC2 | 8614 | 1 | 0 | 10 | |
| GSE74703 | STC2 | 8614 | 2 | 7 | 27 | |
| GSE74704 | STC2 | 8614 | 1 | 6 | 13 | |
| TCGA | STC2 | 8614 | 8 | 34 | 54 |
Total number of gains: 29; Total number of losses: 149; Total Number of normals: 310.
Somatic mutations of STC2:
Generating mutation plots.
Highly correlated genes for STC2:
Showing top 20/1819 corelated genes with mean PCC>0.5.
| Gene1 | Gene2 | Mean PCC | Num. Datasets | Num. PCC<0 | Num. PCC>0.5 |
|---|---|---|---|---|---|
| STC2 | NTMT1 | 0.806633 | 6 | 0 | 6 |
| STC2 | PYCR2 | 0.802388 | 3 | 0 | 3 |
| STC2 | BOLA3 | 0.787212 | 6 | 0 | 6 |
| STC2 | C16orf74 | 0.784878 | 7 | 0 | 7 |
| STC2 | FAM89A | 0.772144 | 3 | 0 | 3 |
| STC2 | KNSTRN | 0.769164 | 5 | 0 | 5 |
| STC2 | ZNF114 | 0.756368 | 4 | 0 | 4 |
| STC2 | SLC35B2 | 0.755216 | 3 | 0 | 3 |
| STC2 | C6orf141 | 0.755195 | 3 | 0 | 3 |
| STC2 | GNG10 | 0.750841 | 3 | 0 | 3 |
| STC2 | MAP4K4 | 0.750786 | 4 | 0 | 4 |
| STC2 | USB1 | 0.749861 | 9 | 0 | 8 |
| STC2 | FCGR3A | 0.746416 | 3 | 0 | 3 |
| STC2 | TP53I13 | 0.744373 | 6 | 0 | 6 |
| STC2 | SCNM1 | 0.744262 | 3 | 0 | 3 |
| STC2 | NGF | 0.744016 | 4 | 0 | 4 |
| STC2 | CYTH3 | 0.738077 | 4 | 0 | 4 |
| STC2 | LPCAT1 | 0.73792 | 10 | 0 | 9 |
| STC2 | PHRF1 | 0.736545 | 3 | 0 | 3 |
| STC2 | ABCB6 | 0.73643 | 3 | 0 | 3 |
For details and further investigation, click here