| Full name: carbonic anhydrase 9 | Alias Symbol: MN|CAIX | ||
| Type: protein-coding gene | Cytoband: 9p13.3 | ||
| Entrez ID: 768 | HGNC ID: HGNC:1383 | Ensembl Gene: ENSG00000107159 | OMIM ID: 603179 |
| Drug and gene relationship at DGIdb | |||
Expression of CA9:
| Dataset | Gene | EntrezID | Probe | Log2FC | Adj.pValue | Expression |
|---|---|---|---|---|---|---|
| GSE17351 | CA9 | 768 | 205199_at | 1.5417 | 0.2400 | |
| GSE20347 | CA9 | 768 | 205199_at | 1.2404 | 0.0001 | |
| GSE23400 | CA9 | 768 | 205199_at | 0.6317 | 0.0000 | |
| GSE26886 | CA9 | 768 | 205199_at | 1.6879 | 0.0009 | |
| GSE29001 | CA9 | 768 | 205199_at | 1.0081 | 0.0242 | |
| GSE38129 | CA9 | 768 | 205199_at | 1.0352 | 0.0018 | |
| GSE45670 | CA9 | 768 | 205199_at | 0.9215 | 0.0644 | |
| GSE53622 | CA9 | 768 | 24211 | 2.7092 | 0.0000 | |
| GSE53624 | CA9 | 768 | 24211 | 2.9658 | 0.0000 | |
| GSE63941 | CA9 | 768 | 205199_at | 0.5505 | 0.5718 | |
| GSE77861 | CA9 | 768 | 205199_at | 0.4553 | 0.2416 | |
| GSE97050 | CA9 | 768 | A_23_P157793 | 1.3062 | 0.1267 | |
| SRP007169 | CA9 | 768 | RNAseq | 8.1597 | 0.0000 | |
| SRP133303 | CA9 | 768 | RNAseq | 3.4610 | 0.0000 | |
| SRP219564 | CA9 | 768 | RNAseq | 1.8115 | 0.0585 | |
| TCGA | CA9 | 768 | RNAseq | -0.8161 | 0.0744 |
Upregulated datasets: 8; Downregulated datasets: 0.
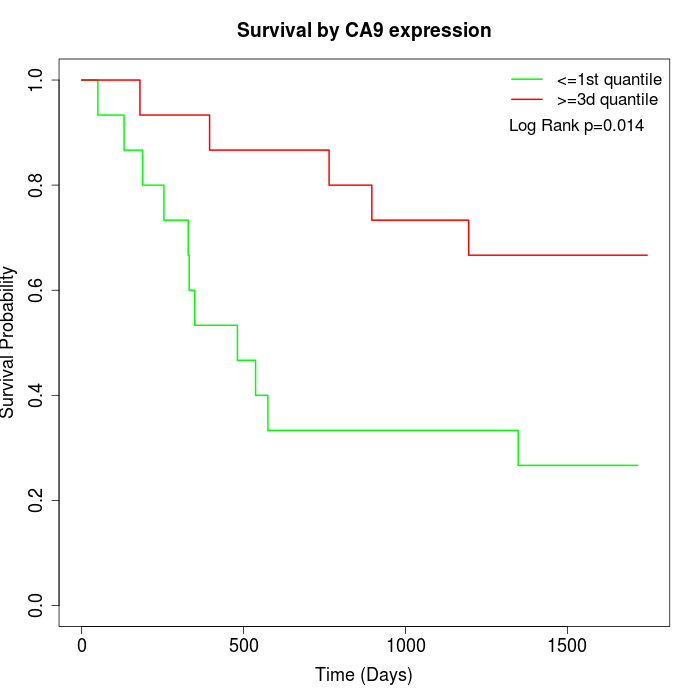
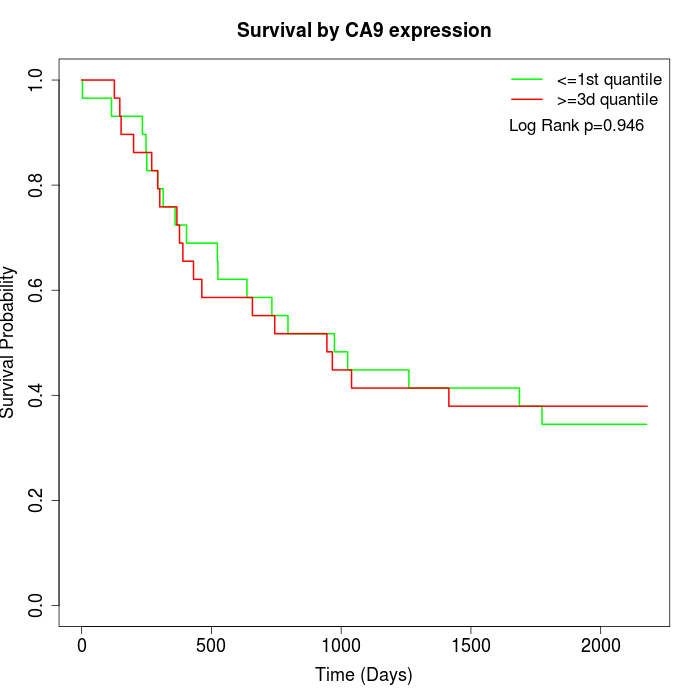
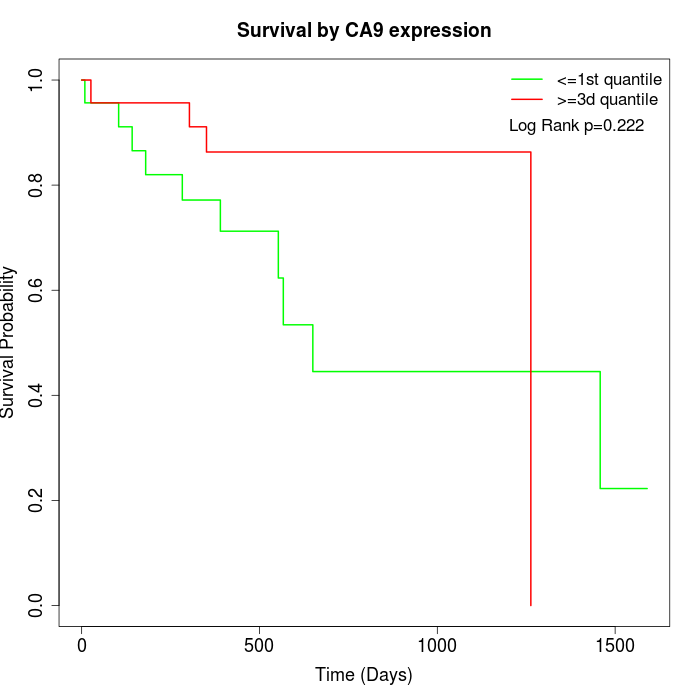
Survival by CA9 expression:
Note: Click image to view full size file.
Copy number change of CA9:
| Dataset | Gene | EntrezID | Gain | Loss | Normal | Detail |
|---|---|---|---|---|---|---|
| GSE15526 | CA9 | 768 | 3 | 12 | 15 | |
| GSE20123 | CA9 | 768 | 3 | 12 | 15 | |
| GSE43470 | CA9 | 768 | 3 | 10 | 30 | |
| GSE46452 | CA9 | 768 | 6 | 15 | 38 | |
| GSE47630 | CA9 | 768 | 1 | 20 | 19 | |
| GSE54993 | CA9 | 768 | 6 | 0 | 64 | |
| GSE54994 | CA9 | 768 | 6 | 12 | 35 | |
| GSE60625 | CA9 | 768 | 0 | 0 | 11 | |
| GSE74703 | CA9 | 768 | 2 | 7 | 27 | |
| GSE74704 | CA9 | 768 | 0 | 10 | 10 | |
| TCGA | CA9 | 768 | 17 | 44 | 35 |
Total number of gains: 47; Total number of losses: 142; Total Number of normals: 299.
Somatic mutations of CA9:
Generating mutation plots.
Highly correlated genes for CA9:
Showing top 20/654 corelated genes with mean PCC>0.5.
| Gene1 | Gene2 | Mean PCC | Num. Datasets | Num. PCC<0 | Num. PCC>0.5 |
|---|---|---|---|---|---|
| CA9 | STAT4 | 0.760527 | 3 | 0 | 3 |
| CA9 | LRRC69 | 0.753513 | 3 | 0 | 3 |
| CA9 | FRMD6-AS1 | 0.749568 | 3 | 0 | 3 |
| CA9 | C14orf93 | 0.727764 | 3 | 0 | 3 |
| CA9 | TMC8 | 0.708358 | 5 | 0 | 5 |
| CA9 | INPP5F | 0.701489 | 3 | 0 | 3 |
| CA9 | ENPEP | 0.697481 | 4 | 0 | 4 |
| CA9 | A1BG | 0.676705 | 3 | 0 | 3 |
| CA9 | MFAP2 | 0.668205 | 10 | 0 | 9 |
| CA9 | PRSS53 | 0.665687 | 3 | 0 | 3 |
| CA9 | DAB2 | 0.665576 | 3 | 0 | 3 |
| CA9 | CTHRC1 | 0.663321 | 7 | 0 | 6 |
| CA9 | PLEKHG4B | 0.662561 | 6 | 0 | 4 |
| CA9 | POLG2 | 0.659514 | 5 | 0 | 4 |
| CA9 | LRRC15 | 0.658676 | 7 | 0 | 6 |
| CA9 | BOP1 | 0.653483 | 3 | 0 | 3 |
| CA9 | UCN2 | 0.650555 | 4 | 0 | 3 |
| CA9 | PDE7A | 0.64995 | 6 | 0 | 6 |
| CA9 | JPH1 | 0.649515 | 3 | 0 | 3 |
| CA9 | ZMYND15 | 0.646405 | 4 | 0 | 3 |
For details and further investigation, click here


