| Full name: phosphodiesterase 7A | Alias Symbol: HCP1 | ||
| Type: protein-coding gene | Cytoband: 8q13.1 | ||
| Entrez ID: 5150 | HGNC ID: HGNC:8791 | Ensembl Gene: ENSG00000205268 | OMIM ID: 171885 |
| Related drugs: CHEMBL484928, CRISABOROLE, DIPYRIDAMOLE, DYPHYLLINE, FLAVOXATE HYDROCHLORIDE, PENTOXIFYLLINE... [more] | |||
Expression of PDE7A:
| Dataset | Gene | EntrezID | Probe | Log2FC | Adj.pValue | Expression |
|---|---|---|---|---|---|---|
| GSE17351 | PDE7A | 5150 | 223358_s_at | 1.6237 | 0.0501 | |
| GSE26886 | PDE7A | 5150 | 223358_s_at | 1.5635 | 0.0002 | |
| GSE45670 | PDE7A | 5150 | 223358_s_at | 0.7508 | 0.0335 | |
| GSE53622 | PDE7A | 5150 | 20326 | 1.3786 | 0.0000 | |
| GSE53624 | PDE7A | 5150 | 20326 | 1.0638 | 0.0000 | |
| GSE63941 | PDE7A | 5150 | 223358_s_at | 0.8089 | 0.1621 | |
| GSE77861 | PDE7A | 5150 | 223358_s_at | 1.1351 | 0.0117 | |
| GSE97050 | PDE7A | 5150 | A_33_P3301955 | 0.9710 | 0.0781 | |
| SRP007169 | PDE7A | 5150 | RNAseq | 0.8786 | 0.0304 | |
| SRP008496 | PDE7A | 5150 | RNAseq | 1.1137 | 0.0001 | |
| SRP064894 | PDE7A | 5150 | RNAseq | 1.4905 | 0.0000 | |
| SRP133303 | PDE7A | 5150 | RNAseq | 0.6948 | 0.0001 | |
| SRP159526 | PDE7A | 5150 | RNAseq | 0.6700 | 0.1973 | |
| SRP193095 | PDE7A | 5150 | RNAseq | 1.0636 | 0.0000 | |
| SRP219564 | PDE7A | 5150 | RNAseq | 1.5813 | 0.0000 | |
| TCGA | PDE7A | 5150 | RNAseq | 0.1174 | 0.1953 |
Upregulated datasets: 8; Downregulated datasets: 0.
Survival by PDE7A expression:
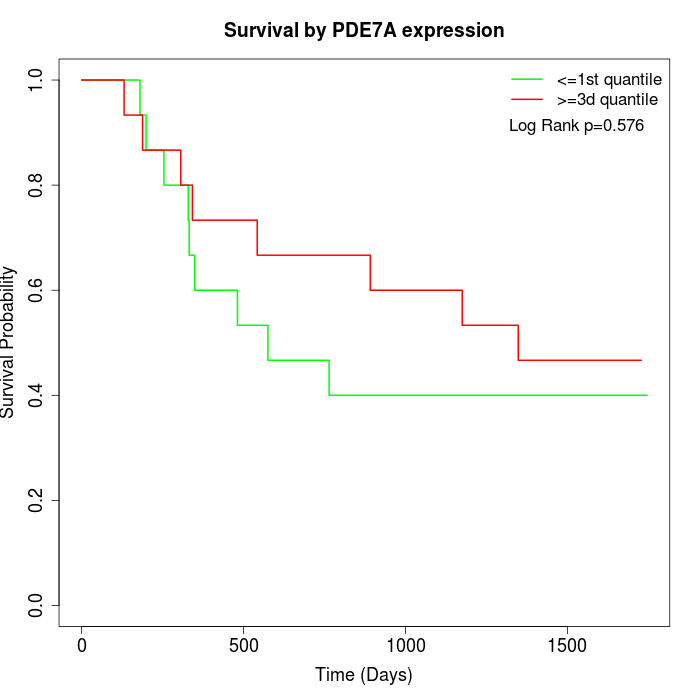 | 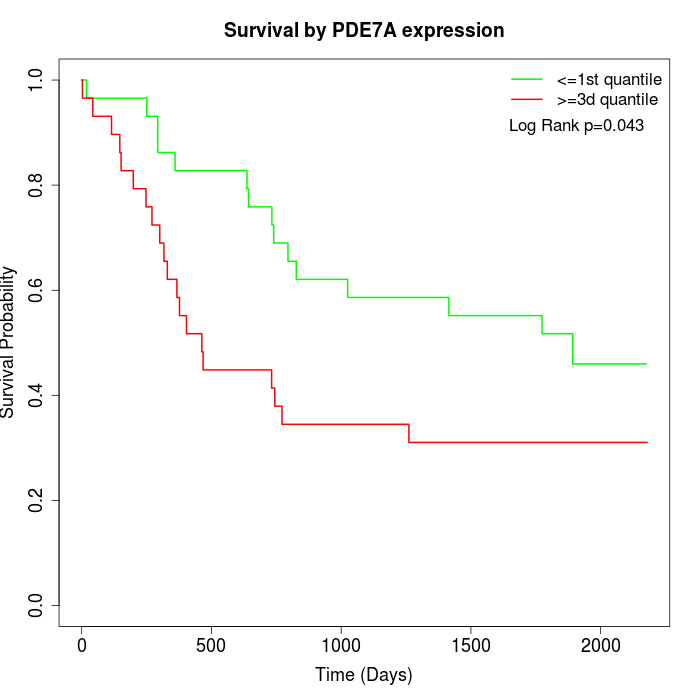 | 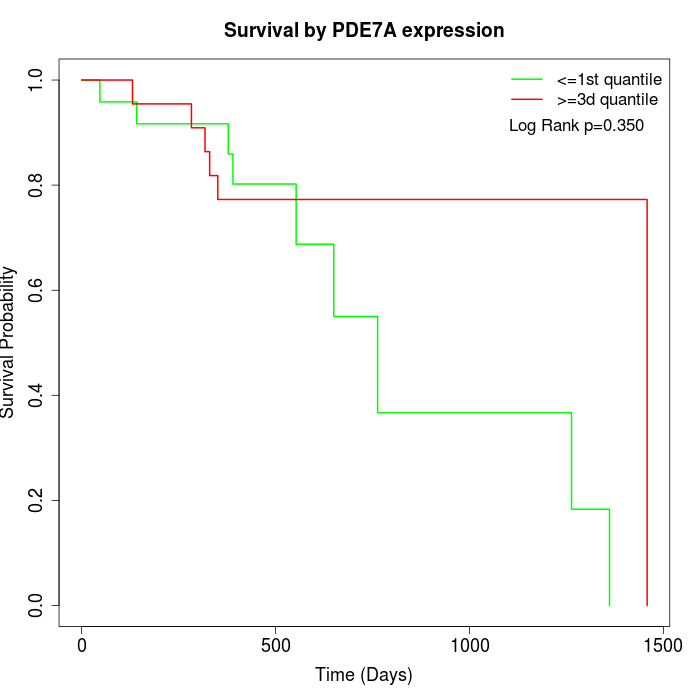 |
| GSE53622 | GSE53624 | TCGA |
Note: Click image to view full size file.
Copy number change of PDE7A:
| Dataset | Gene | EntrezID | Gain | Loss | Normal | Detail |
|---|---|---|---|---|---|---|
| GSE15526 | PDE7A | 5150 | 13 | 1 | 16 | |
| GSE20123 | PDE7A | 5150 | 13 | 1 | 16 | |
| GSE43470 | PDE7A | 5150 | 15 | 3 | 25 | |
| GSE46452 | PDE7A | 5150 | 21 | 1 | 37 | |
| GSE47630 | PDE7A | 5150 | 23 | 1 | 16 | |
| GSE54993 | PDE7A | 5150 | 1 | 18 | 51 | |
| GSE54994 | PDE7A | 5150 | 30 | 0 | 23 | |
| GSE60625 | PDE7A | 5150 | 0 | 4 | 7 | |
| GSE74703 | PDE7A | 5150 | 13 | 2 | 21 | |
| GSE74704 | PDE7A | 5150 | 9 | 0 | 11 | |
| TCGA | PDE7A | 5150 | 49 | 5 | 42 |
Total number of gains: 187; Total number of losses: 36; Total Number of normals: 265.
Somatic mutations of PDE7A:
Generating mutation plots.
Highly correlated genes for PDE7A:
Showing top 20/1946 corelated genes with mean PCC>0.5.
| Gene1 | Gene2 | Mean PCC | Num. Datasets | Num. PCC<0 | Num. PCC>0.5 |
|---|---|---|---|---|---|
| PDE7A | CAPN12 | 0.798615 | 3 | 0 | 3 |
| PDE7A | TRIO | 0.786787 | 7 | 0 | 7 |
| PDE7A | FMNL2 | 0.783897 | 7 | 0 | 7 |
| PDE7A | SOCS7 | 0.782344 | 3 | 0 | 3 |
| PDE7A | VOPP1 | 0.778889 | 7 | 0 | 7 |
| PDE7A | HNRNPUL1 | 0.777288 | 3 | 0 | 3 |
| PDE7A | PLOD1 | 0.775927 | 7 | 0 | 7 |
| PDE7A | RNF4 | 0.763697 | 3 | 0 | 3 |
| PDE7A | TMEM132A | 0.762696 | 5 | 0 | 5 |
| PDE7A | MRPL9 | 0.762568 | 3 | 0 | 3 |
| PDE7A | IGSF6 | 0.760639 | 3 | 0 | 3 |
| PDE7A | MTERF3 | 0.760569 | 4 | 0 | 4 |
| PDE7A | GNS | 0.759511 | 3 | 0 | 3 |
| PDE7A | DERL1 | 0.758809 | 4 | 0 | 4 |
| PDE7A | ARPC1B | 0.758573 | 7 | 0 | 7 |
| PDE7A | NONO | 0.757834 | 6 | 0 | 6 |
| PDE7A | FOXRED2 | 0.756657 | 3 | 0 | 3 |
| PDE7A | DPY19L4 | 0.75501 | 7 | 0 | 7 |
| PDE7A | PTK2 | 0.754457 | 7 | 0 | 7 |
| PDE7A | TRAF5 | 0.752717 | 3 | 0 | 3 |
For details and further investigation, click here