| Full name: family with sequence similarity 189 member A1 | Alias Symbol: KIAA0574|TMEM228 | ||
| Type: protein-coding gene | Cytoband: 15q13.1 | ||
| Entrez ID: 23359 | HGNC ID: HGNC:29075 | Ensembl Gene: ENSG00000104059 | OMIM ID: |
Expression of FAM189A1:
| Dataset | Gene | EntrezID | Probe | Log2FC | Adj.pValue | Expression |
|---|---|---|---|---|---|---|
| GSE17351 | FAM189A1 | 23359 | 213997_at | 0.0990 | 0.7233 | |
| GSE20347 | FAM189A1 | 23359 | 213997_at | 0.0394 | 0.5003 | |
| GSE23400 | FAM189A1 | 23359 | 213997_at | -0.0776 | 0.0409 | |
| GSE26886 | FAM189A1 | 23359 | 213997_at | 0.1468 | 0.0757 | |
| GSE29001 | FAM189A1 | 23359 | 213997_at | -0.1058 | 0.4262 | |
| GSE38129 | FAM189A1 | 23359 | 213997_at | -0.1017 | 0.0857 | |
| GSE45670 | FAM189A1 | 23359 | 213997_at | 0.0630 | 0.4088 | |
| GSE53622 | FAM189A1 | 23359 | 37114 | 0.1698 | 0.0054 | |
| GSE53624 | FAM189A1 | 23359 | 37114 | 0.1511 | 0.0994 | |
| GSE63941 | FAM189A1 | 23359 | 213997_at | 0.2236 | 0.5042 | |
| GSE77861 | FAM189A1 | 23359 | 213997_at | 0.0206 | 0.8317 | |
| GSE97050 | FAM189A1 | 23359 | A_32_P143000 | -0.0745 | 0.7274 | |
| TCGA | FAM189A1 | 23359 | RNAseq | -0.4516 | 0.4126 |
Upregulated datasets: 0; Downregulated datasets: 0.
Survival by FAM189A1 expression:
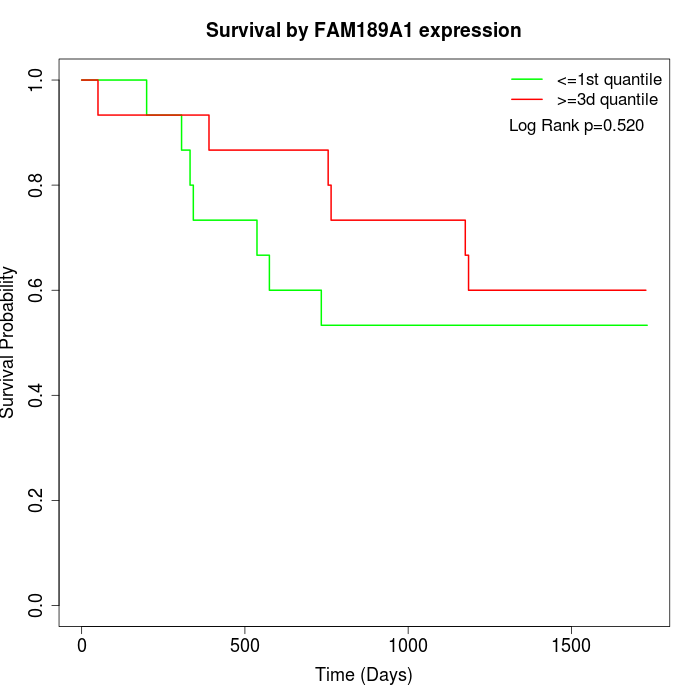 | 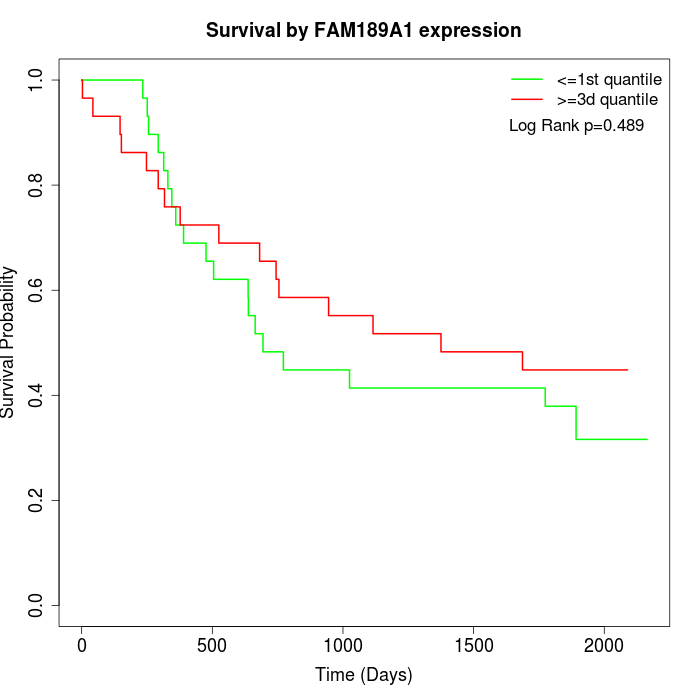 | 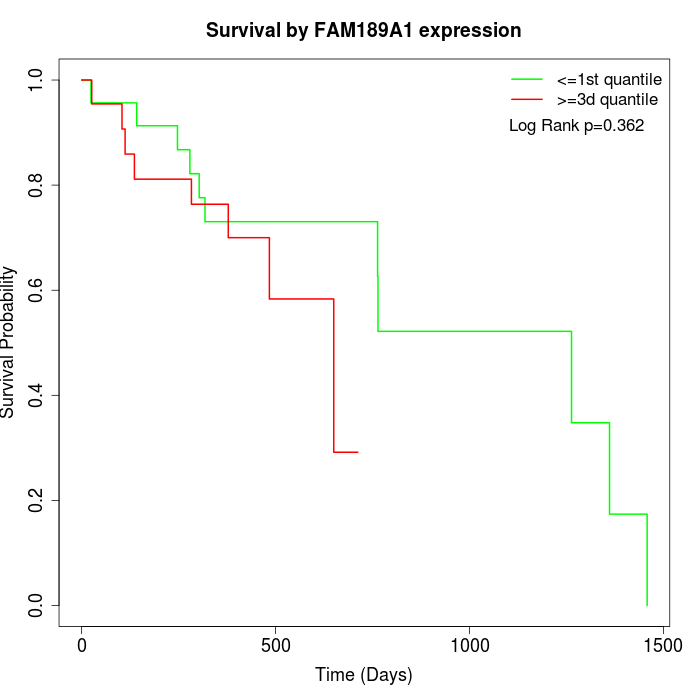 |
| GSE53622 | GSE53624 | TCGA |
Note: Click image to view full size file.
Copy number change of FAM189A1:
| Dataset | Gene | EntrezID | Gain | Loss | Normal | Detail |
|---|---|---|---|---|---|---|
| GSE15526 | FAM189A1 | 23359 | 2 | 8 | 20 | |
| GSE20123 | FAM189A1 | 23359 | 2 | 8 | 20 | |
| GSE43470 | FAM189A1 | 23359 | 4 | 5 | 34 | |
| GSE46452 | FAM189A1 | 23359 | 3 | 7 | 49 | |
| GSE47630 | FAM189A1 | 23359 | 8 | 11 | 21 | |
| GSE54993 | FAM189A1 | 23359 | 4 | 6 | 60 | |
| GSE54994 | FAM189A1 | 23359 | 6 | 7 | 40 | |
| GSE60625 | FAM189A1 | 23359 | 4 | 0 | 7 | |
| GSE74703 | FAM189A1 | 23359 | 4 | 3 | 29 | |
| GSE74704 | FAM189A1 | 23359 | 1 | 6 | 13 | |
| TCGA | FAM189A1 | 23359 | 16 | 16 | 64 |
Total number of gains: 54; Total number of losses: 77; Total Number of normals: 357.
Somatic mutations of FAM189A1:
Generating mutation plots.
Highly correlated genes for FAM189A1:
Showing top 20/389 corelated genes with mean PCC>0.5.
| Gene1 | Gene2 | Mean PCC | Num. Datasets | Num. PCC<0 | Num. PCC>0.5 |
|---|---|---|---|---|---|
| FAM189A1 | DPEP3 | 0.761618 | 3 | 0 | 3 |
| FAM189A1 | MYBPH | 0.754275 | 3 | 0 | 3 |
| FAM189A1 | SPTA1 | 0.735781 | 3 | 0 | 3 |
| FAM189A1 | MYO15B | 0.727445 | 3 | 0 | 3 |
| FAM189A1 | APOM | 0.71891 | 3 | 0 | 3 |
| FAM189A1 | CCR6 | 0.716388 | 3 | 0 | 3 |
| FAM189A1 | BCL2L10 | 0.716356 | 3 | 0 | 3 |
| FAM189A1 | NPW | 0.715606 | 3 | 0 | 3 |
| FAM189A1 | MYO1A | 0.715556 | 3 | 0 | 3 |
| FAM189A1 | HAAO | 0.712894 | 3 | 0 | 3 |
| FAM189A1 | AOC2 | 0.710357 | 4 | 0 | 4 |
| FAM189A1 | CSHL1 | 0.709889 | 3 | 0 | 3 |
| FAM189A1 | LRIT1 | 0.708781 | 3 | 0 | 3 |
| FAM189A1 | GRID2 | 0.705445 | 4 | 0 | 4 |
| FAM189A1 | PAX7 | 0.699246 | 3 | 0 | 3 |
| FAM189A1 | ZNF182 | 0.695235 | 4 | 0 | 3 |
| FAM189A1 | OR56A5 | 0.693121 | 3 | 0 | 3 |
| FAM189A1 | OR2G2 | 0.686233 | 3 | 0 | 3 |
| FAM189A1 | IFNA4 | 0.682406 | 4 | 0 | 3 |
| FAM189A1 | SV2C | 0.680931 | 4 | 0 | 3 |
For details and further investigation, click here