| Full name: spectrin alpha, erythrocytic 1 | Alias Symbol: EL2 | ||
| Type: protein-coding gene | Cytoband: 1q23.1 | ||
| Entrez ID: 6708 | HGNC ID: HGNC:11272 | Ensembl Gene: ENSG00000163554 | OMIM ID: 182860 |
| Drug and gene relationship at DGIdb | |||
Screen Evidence:
| |||
SPTA1 involved pathways:
| KEGG pathway | Description | View |
|---|---|---|
| hsa04210 | Apoptosis |
Expression of SPTA1:
| Dataset | Gene | EntrezID | Probe | Log2FC | Adj.pValue | Expression |
|---|---|---|---|---|---|---|
| GSE17351 | SPTA1 | 6708 | 206937_at | 0.0537 | 0.8436 | |
| GSE20347 | SPTA1 | 6708 | 206937_at | 0.0715 | 0.1638 | |
| GSE23400 | SPTA1 | 6708 | 206937_at | -0.0098 | 0.7327 | |
| GSE26886 | SPTA1 | 6708 | 206937_at | 0.1869 | 0.0577 | |
| GSE29001 | SPTA1 | 6708 | 206937_at | 0.0969 | 0.6099 | |
| GSE38129 | SPTA1 | 6708 | 206937_at | 0.0378 | 0.5101 | |
| GSE45670 | SPTA1 | 6708 | 206937_at | 0.1851 | 0.0373 | |
| GSE53622 | SPTA1 | 6708 | 136122 | 0.4801 | 0.0583 | |
| GSE53624 | SPTA1 | 6708 | 136122 | 0.7436 | 0.0000 | |
| GSE63941 | SPTA1 | 6708 | 206937_at | -0.0600 | 0.6435 | |
| GSE77861 | SPTA1 | 6708 | 206937_at | -0.0133 | 0.9211 | |
| GSE97050 | SPTA1 | 6708 | A_23_P63158 | -0.0419 | 0.8714 | |
| TCGA | SPTA1 | 6708 | RNAseq | 2.1035 | 0.0657 |
Upregulated datasets: 0; Downregulated datasets: 0.
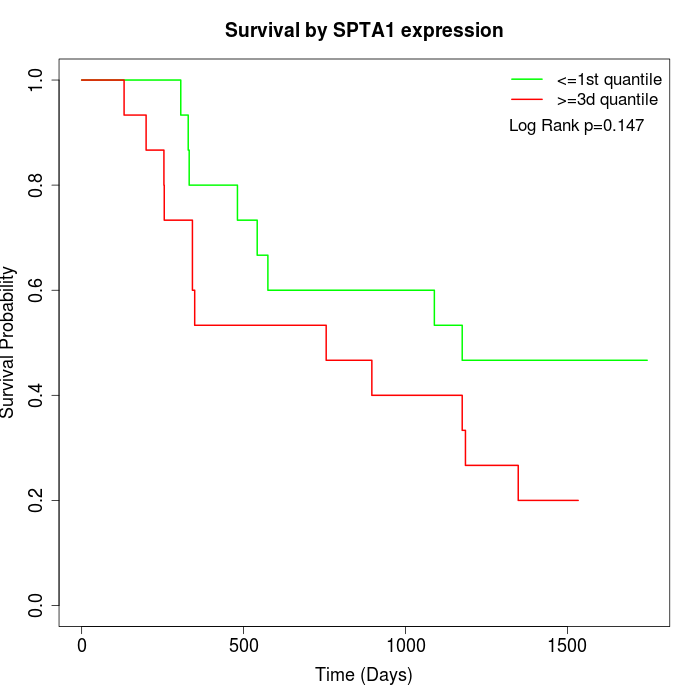
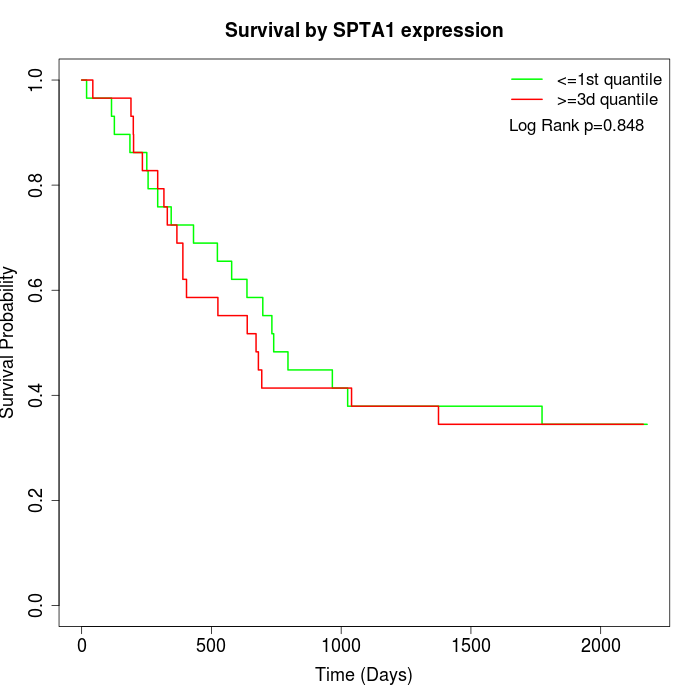
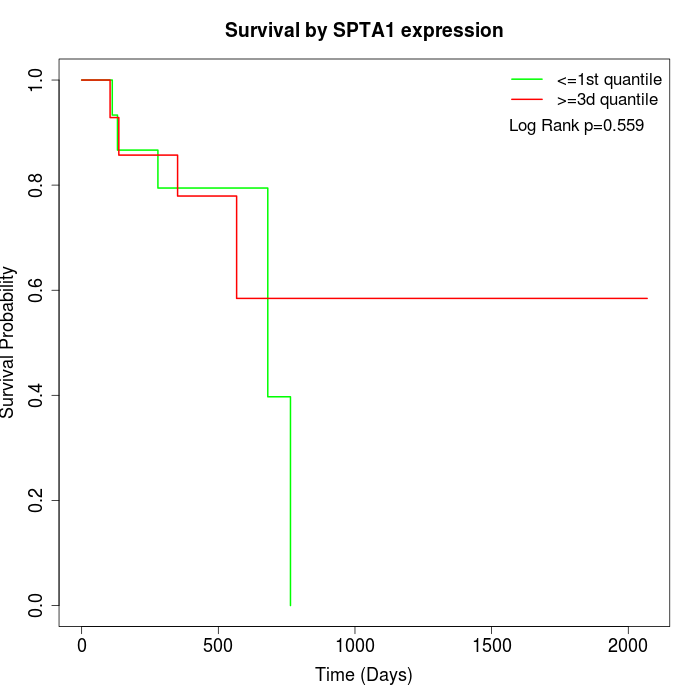
Survival by SPTA1 expression:
Note: Click image to view full size file.
Copy number change of SPTA1:
| Dataset | Gene | EntrezID | Gain | Loss | Normal | Detail |
|---|---|---|---|---|---|---|
| GSE15526 | SPTA1 | 6708 | 8 | 0 | 22 | |
| GSE20123 | SPTA1 | 6708 | 8 | 0 | 22 | |
| GSE43470 | SPTA1 | 6708 | 7 | 2 | 34 | |
| GSE46452 | SPTA1 | 6708 | 2 | 1 | 56 | |
| GSE47630 | SPTA1 | 6708 | 14 | 0 | 26 | |
| GSE54993 | SPTA1 | 6708 | 0 | 5 | 65 | |
| GSE54994 | SPTA1 | 6708 | 16 | 0 | 37 | |
| GSE60625 | SPTA1 | 6708 | 0 | 0 | 11 | |
| GSE74703 | SPTA1 | 6708 | 7 | 2 | 27 | |
| GSE74704 | SPTA1 | 6708 | 3 | 0 | 17 | |
| TCGA | SPTA1 | 6708 | 40 | 3 | 53 |
Total number of gains: 105; Total number of losses: 13; Total Number of normals: 370.
Somatic mutations of SPTA1:
Generating mutation plots.
Highly correlated genes for SPTA1:
Showing top 20/432 corelated genes with mean PCC>0.5.
| Gene1 | Gene2 | Mean PCC | Num. Datasets | Num. PCC<0 | Num. PCC>0.5 |
|---|---|---|---|---|---|
| SPTA1 | SCGN | 0.79582 | 3 | 0 | 3 |
| SPTA1 | F2RL3 | 0.792596 | 3 | 0 | 3 |
| SPTA1 | CDH10 | 0.781739 | 3 | 0 | 3 |
| SPTA1 | USH1C | 0.775299 | 3 | 0 | 3 |
| SPTA1 | BPIFC | 0.762215 | 3 | 0 | 3 |
| SPTA1 | IL20 | 0.75693 | 4 | 0 | 3 |
| SPTA1 | DMC1 | 0.752523 | 3 | 0 | 3 |
| SPTA1 | TRIM43 | 0.752252 | 4 | 0 | 4 |
| SPTA1 | OBSL1 | 0.742279 | 4 | 0 | 4 |
| SPTA1 | KIR3DL3 | 0.739683 | 4 | 0 | 4 |
| SPTA1 | FAM189A1 | 0.735781 | 3 | 0 | 3 |
| SPTA1 | C4BPA | 0.72171 | 4 | 0 | 3 |
| SPTA1 | CDHR2 | 0.720886 | 3 | 0 | 3 |
| SPTA1 | FASLG | 0.719669 | 4 | 0 | 3 |
| SPTA1 | WNT1 | 0.717815 | 3 | 0 | 3 |
| SPTA1 | GNRHR | 0.716484 | 3 | 0 | 3 |
| SPTA1 | HMGCLL1 | 0.715814 | 3 | 0 | 3 |
| SPTA1 | PPM1E | 0.714534 | 3 | 0 | 3 |
| SPTA1 | OPN4 | 0.713295 | 3 | 0 | 3 |
| SPTA1 | CPNE6 | 0.707327 | 4 | 0 | 4 |
For details and further investigation, click here


