| Full name: fibrinogen gamma chain | Alias Symbol: | ||
| Type: protein-coding gene | Cytoband: 4q32.1 | ||
| Entrez ID: 2266 | HGNC ID: HGNC:3694 | Ensembl Gene: ENSG00000171557 | OMIM ID: 134850 |
| Related drugs: ALFIMEPRASE, FIBRINOLYSIN, HUMAN... [more] | |||
FGG involved pathways:
| KEGG pathway | Description | View |
|---|---|---|
| hsa04610 | Complement and coagulation cascades | |
| hsa04611 | Platelet activation |
Expression of FGG:
| Dataset | Gene | EntrezID | Probe | Log2FC | Adj.pValue | Expression |
|---|---|---|---|---|---|---|
| GSE17351 | FGG | 2266 | 219612_s_at | -0.0358 | 0.9028 | |
| GSE20347 | FGG | 2266 | 219612_s_at | 0.0209 | 0.7481 | |
| GSE23400 | FGG | 2266 | 219612_s_at | -0.0319 | 0.2281 | |
| GSE26886 | FGG | 2266 | 219612_s_at | 0.3662 | 0.0820 | |
| GSE29001 | FGG | 2266 | 219612_s_at | 0.0354 | 0.7990 | |
| GSE38129 | FGG | 2266 | 219612_s_at | -0.1712 | 0.3848 | |
| GSE45670 | FGG | 2266 | 219612_s_at | 0.1798 | 0.3137 | |
| GSE53622 | FGG | 2266 | 34116 | -0.0948 | 0.6850 | |
| GSE53624 | FGG | 2266 | 34116 | 0.1604 | 0.3682 | |
| GSE63941 | FGG | 2266 | 219612_s_at | -0.0227 | 0.8972 | |
| GSE77861 | FGG | 2266 | 219612_s_at | -0.1467 | 0.2583 | |
| GSE97050 | FGG | 2266 | A_23_P148088 | 0.2270 | 0.6520 | |
| TCGA | FGG | 2266 | RNAseq | -4.0308 | 0.0016 |
Upregulated datasets: 0; Downregulated datasets: 1.
Survival by FGG expression:
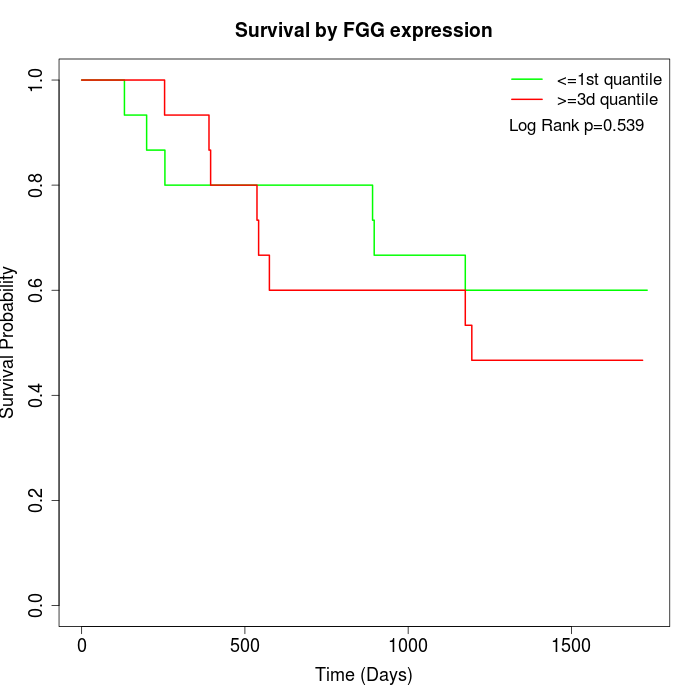 | 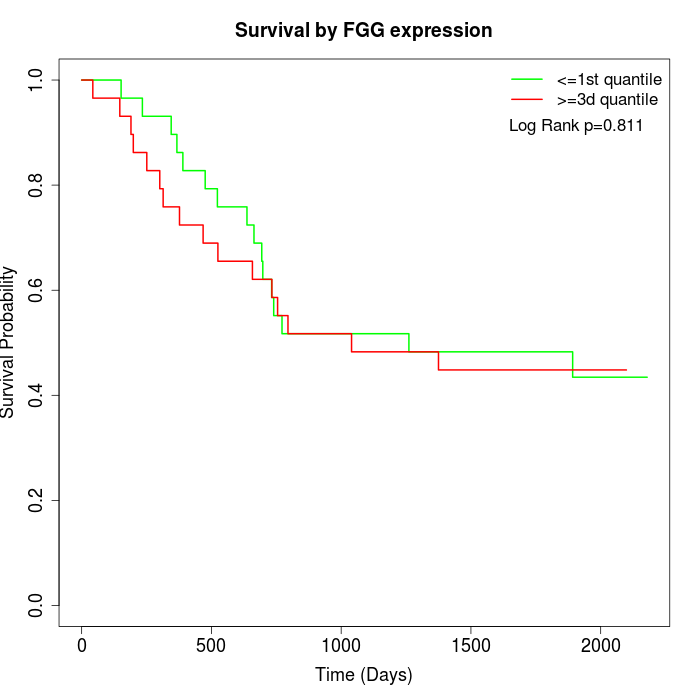 | 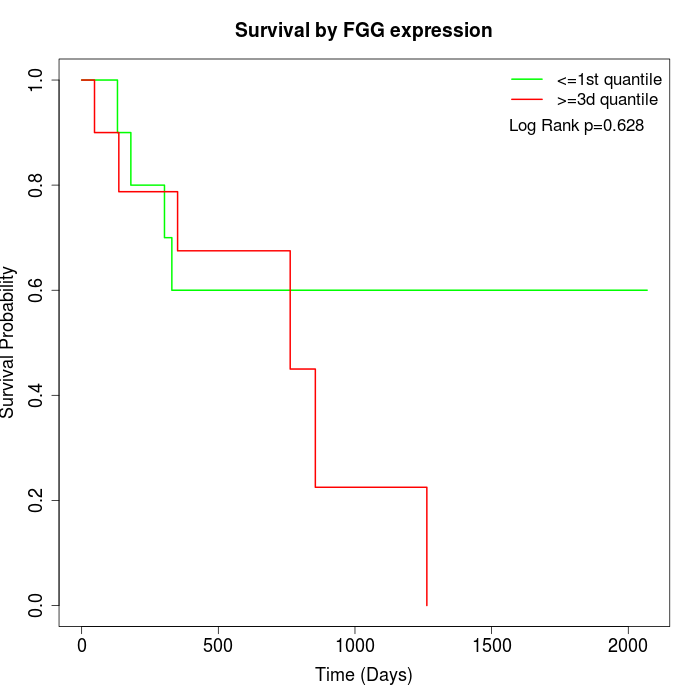 |
| GSE53622 | GSE53624 | TCGA |
Note: Click image to view full size file.
Copy number change of FGG:
| Dataset | Gene | EntrezID | Gain | Loss | Normal | Detail |
|---|---|---|---|---|---|---|
| GSE15526 | FGG | 2266 | 0 | 14 | 16 | |
| GSE20123 | FGG | 2266 | 0 | 14 | 16 | |
| GSE43470 | FGG | 2266 | 0 | 13 | 30 | |
| GSE46452 | FGG | 2266 | 1 | 36 | 22 | |
| GSE47630 | FGG | 2266 | 0 | 23 | 17 | |
| GSE54993 | FGG | 2266 | 10 | 0 | 60 | |
| GSE54994 | FGG | 2266 | 1 | 13 | 39 | |
| GSE60625 | FGG | 2266 | 0 | 1 | 10 | |
| GSE74703 | FGG | 2266 | 0 | 11 | 25 | |
| GSE74704 | FGG | 2266 | 0 | 7 | 13 | |
| TCGA | FGG | 2266 | 10 | 34 | 52 |
Total number of gains: 22; Total number of losses: 166; Total Number of normals: 300.
Somatic mutations of FGG:
Generating mutation plots.
Highly correlated genes for FGG:
Showing top 20/422 corelated genes with mean PCC>0.5.
| Gene1 | Gene2 | Mean PCC | Num. Datasets | Num. PCC<0 | Num. PCC>0.5 |
|---|---|---|---|---|---|
| FGG | SLC4A9 | 0.748721 | 3 | 0 | 3 |
| FGG | CDRT15 | 0.697363 | 3 | 0 | 3 |
| FGG | GPD1 | 0.693935 | 3 | 0 | 3 |
| FGG | KLK14 | 0.685054 | 4 | 0 | 4 |
| FGG | IGFL2 | 0.684371 | 3 | 0 | 3 |
| FGG | RASL10A | 0.679453 | 3 | 0 | 3 |
| FGG | CCL27 | 0.678092 | 4 | 0 | 4 |
| FGG | IQCH | 0.676342 | 3 | 0 | 3 |
| FGG | CST8 | 0.674178 | 3 | 0 | 3 |
| FGG | KLHL35 | 0.673075 | 4 | 0 | 4 |
| FGG | TRPV3 | 0.66642 | 3 | 0 | 3 |
| FGG | DNMT3L | 0.66288 | 4 | 0 | 3 |
| FGG | KIF26A | 0.661168 | 3 | 0 | 3 |
| FGG | MYO18B | 0.65931 | 3 | 0 | 3 |
| FGG | DEFA4 | 0.656909 | 3 | 0 | 3 |
| FGG | VMO1 | 0.656657 | 3 | 0 | 3 |
| FGG | AFP | 0.656417 | 4 | 0 | 3 |
| FGG | NR2E1 | 0.655605 | 4 | 0 | 3 |
| FGG | FTCD | 0.655302 | 4 | 0 | 4 |
| FGG | BRS3 | 0.655032 | 3 | 0 | 3 |
For details and further investigation, click here