| Full name: fibroblast growth factor 10 | Alias Symbol: | ||
| Type: protein-coding gene | Cytoband: 5p12 | ||
| Entrez ID: 2255 | HGNC ID: HGNC:3666 | Ensembl Gene: ENSG00000070193 | OMIM ID: 602115 |
FGF10 involved pathways:
Expression of FGF10:
| Dataset | Gene | EntrezID | Probe | Log2FC | Adj.pValue | Expression |
|---|---|---|---|---|---|---|
| GSE17351 | FGF10 | 2255 | 231762_at | -0.4080 | 0.1126 | |
| GSE26886 | FGF10 | 2255 | 231762_at | 0.0034 | 0.9782 | |
| GSE45670 | FGF10 | 2255 | 231762_at | -0.2413 | 0.0086 | |
| GSE53622 | FGF10 | 2255 | 22351 | -2.5306 | 0.0000 | |
| GSE53624 | FGF10 | 2255 | 22351 | -1.7518 | 0.0000 | |
| GSE63941 | FGF10 | 2255 | 231762_at | -1.4053 | 0.0353 | |
| GSE77861 | FGF10 | 2255 | 231762_at | -0.1374 | 0.2462 | |
| GSE97050 | FGF10 | 2255 | A_23_P377750 | 0.1596 | 0.4065 | |
| SRP064894 | FGF10 | 2255 | RNAseq | -0.4104 | 0.4220 | |
| SRP133303 | FGF10 | 2255 | RNAseq | -1.7202 | 0.0000 | |
| SRP159526 | FGF10 | 2255 | RNAseq | -0.5235 | 0.2885 | |
| SRP219564 | FGF10 | 2255 | RNAseq | 0.4778 | 0.5925 | |
| TCGA | FGF10 | 2255 | RNAseq | -3.1016 | 0.0004 |
Upregulated datasets: 0; Downregulated datasets: 5.
Survival by FGF10 expression:
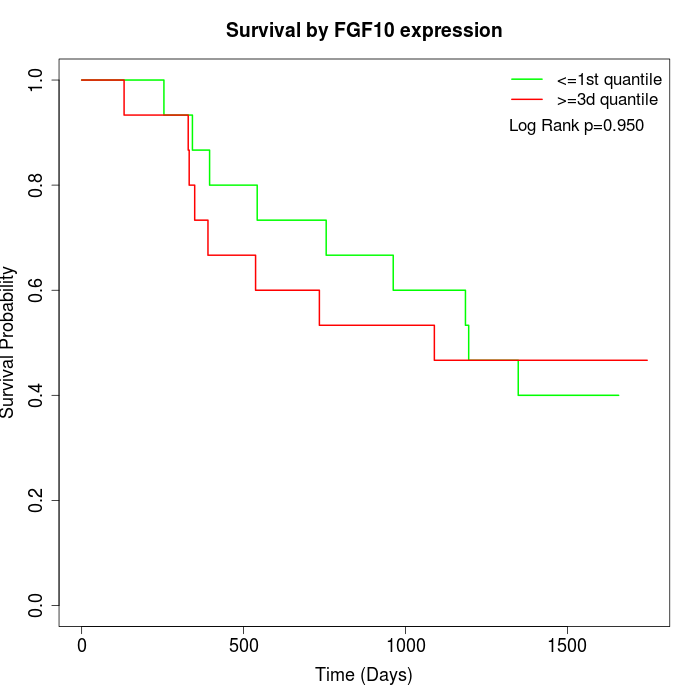 | 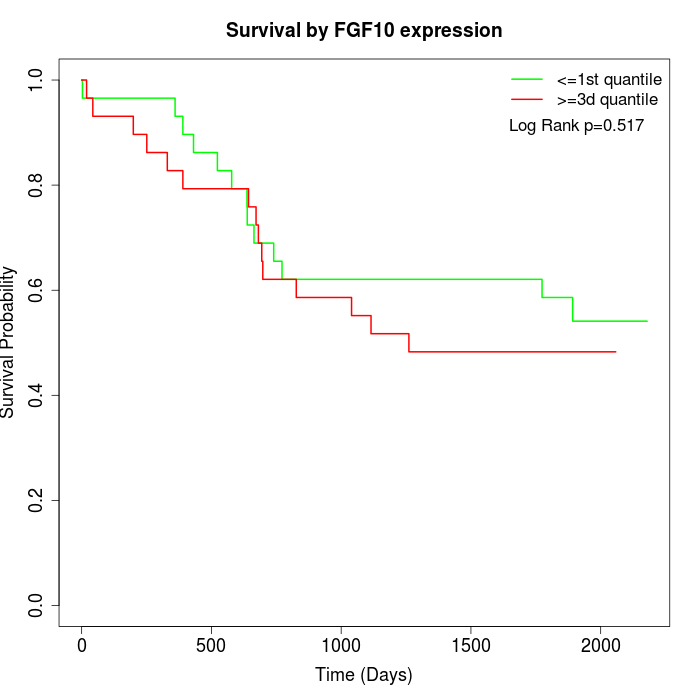 | 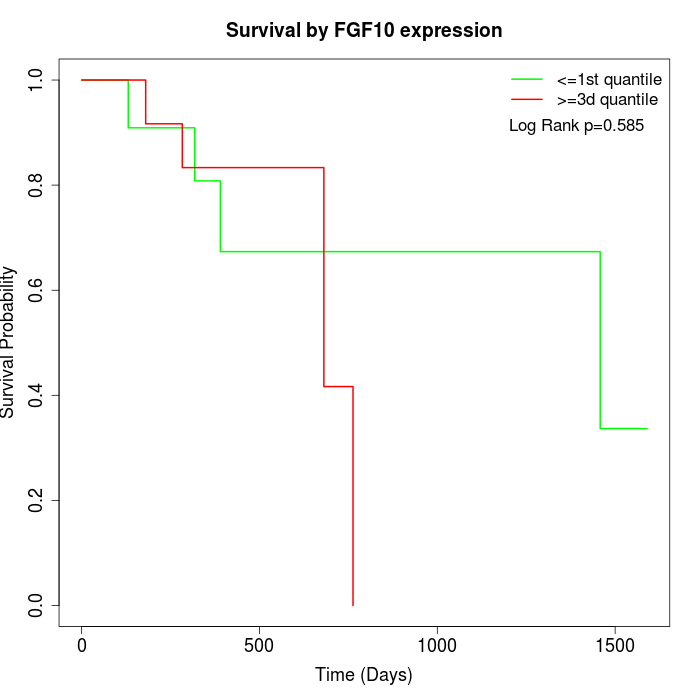 |
| GSE53622 | GSE53624 | TCGA |
Note: Click image to view full size file.
Copy number change of FGF10:
| Dataset | Gene | EntrezID | Gain | Loss | Normal | Detail |
|---|---|---|---|---|---|---|
| GSE15526 | FGF10 | 2255 | 10 | 1 | 19 | |
| GSE20123 | FGF10 | 2255 | 10 | 1 | 19 | |
| GSE43470 | FGF10 | 2255 | 16 | 0 | 27 | |
| GSE46452 | FGF10 | 2255 | 5 | 22 | 32 | |
| GSE47630 | FGF10 | 2255 | 6 | 12 | 22 | |
| GSE54993 | FGF10 | 2255 | 6 | 3 | 61 | |
| GSE54994 | FGF10 | 2255 | 24 | 2 | 27 | |
| GSE60625 | FGF10 | 2255 | 0 | 0 | 11 | |
| GSE74703 | FGF10 | 2255 | 13 | 0 | 23 | |
| GSE74704 | FGF10 | 2255 | 9 | 1 | 10 | |
| TCGA | FGF10 | 2255 | 52 | 8 | 36 |
Total number of gains: 151; Total number of losses: 50; Total Number of normals: 287.
Somatic mutations of FGF10:
Generating mutation plots.
Highly correlated genes for FGF10:
Showing top 20/221 corelated genes with mean PCC>0.5.
| Gene1 | Gene2 | Mean PCC | Num. Datasets | Num. PCC<0 | Num. PCC>0.5 |
|---|---|---|---|---|---|
| FGF10 | CFP | 0.735928 | 3 | 0 | 3 |
| FGF10 | FAM107A | 0.726626 | 4 | 0 | 3 |
| FGF10 | LGI1 | 0.723565 | 4 | 0 | 3 |
| FGF10 | MEF2C | 0.71848 | 4 | 0 | 4 |
| FGF10 | ACKR1 | 0.699824 | 4 | 0 | 3 |
| FGF10 | RSPO1 | 0.679888 | 5 | 0 | 5 |
| FGF10 | RAI2 | 0.676499 | 4 | 0 | 3 |
| FGF10 | TEK | 0.675728 | 4 | 0 | 3 |
| FGF10 | SEMA3G | 0.673172 | 4 | 0 | 3 |
| FGF10 | GNA14 | 0.67186 | 6 | 0 | 5 |
| FGF10 | PLCXD3 | 0.670932 | 5 | 0 | 4 |
| FGF10 | P2RY14 | 0.669566 | 6 | 0 | 4 |
| FGF10 | ARHGAP20 | 0.667199 | 4 | 0 | 3 |
| FGF10 | RBPMS2 | 0.66669 | 3 | 0 | 3 |
| FGF10 | CCDC160 | 0.664121 | 4 | 0 | 4 |
| FGF10 | NOSTRIN | 0.663876 | 4 | 0 | 3 |
| FGF10 | NDNF | 0.663614 | 5 | 0 | 4 |
| FGF10 | C1QTNF2 | 0.662246 | 4 | 0 | 4 |
| FGF10 | LINC00844 | 0.659443 | 3 | 0 | 3 |
| FGF10 | NPDC1 | 0.659357 | 3 | 0 | 3 |
For details and further investigation, click here