| Full name: neural proliferation, differentiation and control 1 | Alias Symbol: DKFZp586J0523|CAB-|CAB1 | ||
| Type: protein-coding gene | Cytoband: 9q34.3 | ||
| Entrez ID: 56654 | HGNC ID: HGNC:7899 | Ensembl Gene: ENSG00000107281 | OMIM ID: 605798 |
Expression of NPDC1:
| Dataset | Gene | EntrezID | Probe | Log2FC | Adj.pValue | Expression |
|---|---|---|---|---|---|---|
| GSE17351 | NPDC1 | 56654 | 218086_at | -0.6625 | 0.2014 | |
| GSE20347 | NPDC1 | 56654 | 218086_at | -0.2051 | 0.1906 | |
| GSE23400 | NPDC1 | 56654 | 218086_at | -0.3195 | 0.0009 | |
| GSE26886 | NPDC1 | 56654 | 218086_at | 0.8296 | 0.0011 | |
| GSE29001 | NPDC1 | 56654 | 218086_at | -0.2731 | 0.1391 | |
| GSE38129 | NPDC1 | 56654 | 218086_at | -0.3649 | 0.1287 | |
| GSE45670 | NPDC1 | 56654 | 218086_at | -0.5465 | 0.0160 | |
| GSE53622 | NPDC1 | 56654 | 54228 | -0.8801 | 0.0000 | |
| GSE53624 | NPDC1 | 56654 | 54228 | -0.6486 | 0.0000 | |
| GSE63941 | NPDC1 | 56654 | 218086_at | -0.9759 | 0.2765 | |
| GSE77861 | NPDC1 | 56654 | 218086_at | 0.2414 | 0.4250 | |
| GSE97050 | NPDC1 | 56654 | A_23_P146572 | -0.1057 | 0.7474 | |
| SRP007169 | NPDC1 | 56654 | RNAseq | -0.7859 | 0.2462 | |
| SRP008496 | NPDC1 | 56654 | RNAseq | -0.1873 | 0.7092 | |
| SRP064894 | NPDC1 | 56654 | RNAseq | -1.1984 | 0.0050 | |
| SRP133303 | NPDC1 | 56654 | RNAseq | -1.0349 | 0.0016 | |
| SRP159526 | NPDC1 | 56654 | RNAseq | -0.1856 | 0.4810 | |
| SRP193095 | NPDC1 | 56654 | RNAseq | 0.1751 | 0.6168 | |
| SRP219564 | NPDC1 | 56654 | RNAseq | -0.0101 | 0.9874 | |
| TCGA | NPDC1 | 56654 | RNAseq | -0.5683 | 0.0000 |
Upregulated datasets: 0; Downregulated datasets: 2.
Survival by NPDC1 expression:
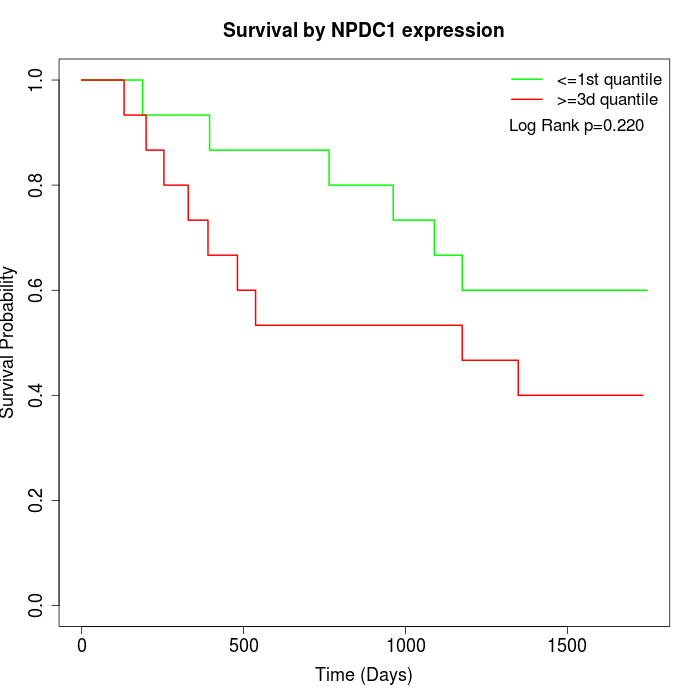 | 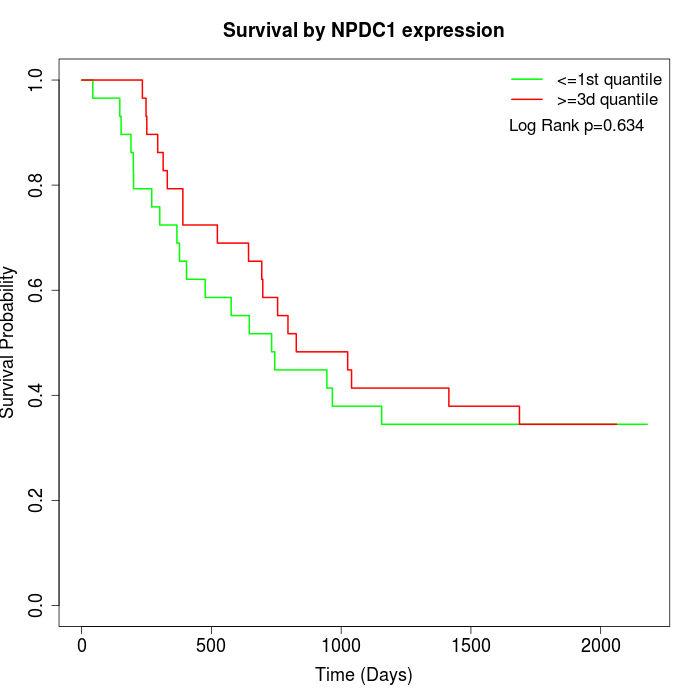 | 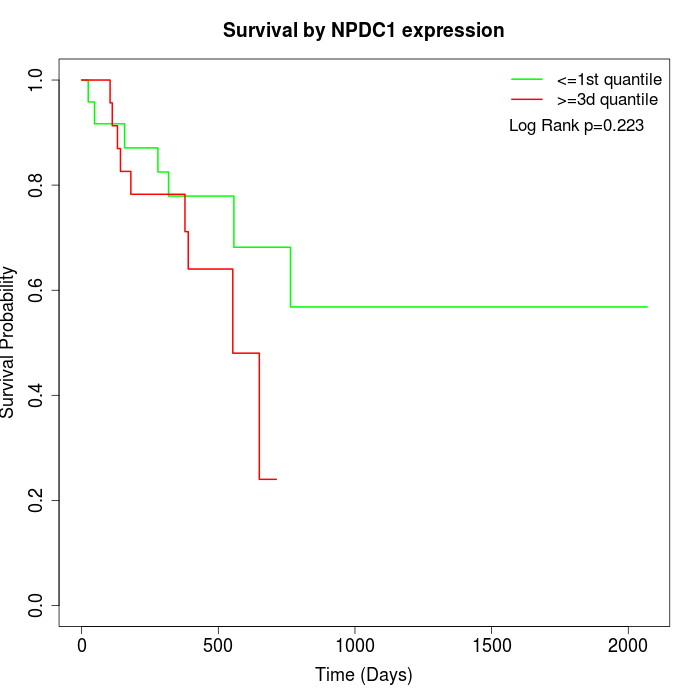 |
| GSE53622 | GSE53624 | TCGA |
Note: Click image to view full size file.
Copy number change of NPDC1:
| Dataset | Gene | EntrezID | Gain | Loss | Normal | Detail |
|---|---|---|---|---|---|---|
| GSE15526 | NPDC1 | 56654 | 5 | 7 | 18 | |
| GSE20123 | NPDC1 | 56654 | 5 | 7 | 18 | |
| GSE43470 | NPDC1 | 56654 | 3 | 7 | 33 | |
| GSE46452 | NPDC1 | 56654 | 6 | 13 | 40 | |
| GSE47630 | NPDC1 | 56654 | 6 | 15 | 19 | |
| GSE54993 | NPDC1 | 56654 | 3 | 3 | 64 | |
| GSE54994 | NPDC1 | 56654 | 12 | 8 | 33 | |
| GSE60625 | NPDC1 | 56654 | 0 | 0 | 11 | |
| GSE74703 | NPDC1 | 56654 | 3 | 5 | 28 | |
| GSE74704 | NPDC1 | 56654 | 3 | 5 | 12 | |
| TCGA | NPDC1 | 56654 | 29 | 23 | 44 |
Total number of gains: 75; Total number of losses: 93; Total Number of normals: 320.
Somatic mutations of NPDC1:
Generating mutation plots.
Highly correlated genes for NPDC1:
Showing top 20/494 corelated genes with mean PCC>0.5.
| Gene1 | Gene2 | Mean PCC | Num. Datasets | Num. PCC<0 | Num. PCC>0.5 |
|---|---|---|---|---|---|
| NPDC1 | PYROXD2 | 0.664924 | 3 | 0 | 3 |
| NPDC1 | TEK | 0.659837 | 6 | 0 | 5 |
| NPDC1 | FGF10 | 0.659357 | 3 | 0 | 3 |
| NPDC1 | RNF112 | 0.658957 | 4 | 0 | 3 |
| NPDC1 | CYP21A2 | 0.65663 | 3 | 0 | 3 |
| NPDC1 | PRKAR2B | 0.654848 | 7 | 0 | 7 |
| NPDC1 | SDC3 | 0.650806 | 4 | 0 | 3 |
| NPDC1 | PLAC9 | 0.650218 | 5 | 0 | 4 |
| NPDC1 | A2M | 0.649379 | 7 | 0 | 7 |
| NPDC1 | KCNT2 | 0.649127 | 5 | 0 | 4 |
| NPDC1 | CHRDL1 | 0.642945 | 8 | 0 | 7 |
| NPDC1 | RCAN2 | 0.63767 | 9 | 0 | 8 |
| NPDC1 | LIFR | 0.636068 | 6 | 0 | 6 |
| NPDC1 | ZER1 | 0.631281 | 6 | 0 | 6 |
| NPDC1 | TCEAL2 | 0.630748 | 7 | 0 | 6 |
| NPDC1 | LINC-PINT | 0.630677 | 3 | 0 | 3 |
| NPDC1 | CD34 | 0.628991 | 7 | 0 | 6 |
| NPDC1 | SMARCD3 | 0.627268 | 8 | 0 | 6 |
| NPDC1 | PLCXD3 | 0.626448 | 4 | 0 | 3 |
| NPDC1 | TNS1 | 0.626319 | 9 | 0 | 7 |
For details and further investigation, click here