| Full name: flavin containing dimethylaniline monoxygenase 1 | Alias Symbol: | ||
| Type: protein-coding gene | Cytoband: 1q24.3 | ||
| Entrez ID: 2326 | HGNC ID: HGNC:3769 | Ensembl Gene: ENSG00000010932 | OMIM ID: 136130 |
Expression of FMO1:
| Dataset | Gene | EntrezID | Probe | Log2FC | Adj.pValue | Expression |
|---|---|---|---|---|---|---|
| GSE17351 | FMO1 | 2326 | 205666_at | 0.6750 | 0.5980 | |
| GSE20347 | FMO1 | 2326 | 205666_at | 0.5179 | 0.1070 | |
| GSE23400 | FMO1 | 2326 | 205666_at | 0.2096 | 0.0011 | |
| GSE26886 | FMO1 | 2326 | 205666_at | -0.3872 | 0.5644 | |
| GSE29001 | FMO1 | 2326 | 205666_at | -0.5637 | 0.0476 | |
| GSE38129 | FMO1 | 2326 | 205666_at | 0.6253 | 0.0109 | |
| GSE45670 | FMO1 | 2326 | 205666_at | 0.4341 | 0.2142 | |
| GSE53622 | FMO1 | 2326 | 46424 | 1.1378 | 0.0000 | |
| GSE53624 | FMO1 | 2326 | 46424 | 0.7397 | 0.0002 | |
| GSE63941 | FMO1 | 2326 | 205666_at | -0.0998 | 0.5227 | |
| GSE77861 | FMO1 | 2326 | 205666_at | -0.2826 | 0.0835 | |
| GSE97050 | FMO1 | 2326 | A_23_P149613 | 0.3228 | 0.2063 | |
| SRP007169 | FMO1 | 2326 | RNAseq | 1.1641 | 0.1855 | |
| SRP064894 | FMO1 | 2326 | RNAseq | 1.9085 | 0.0000 | |
| SRP133303 | FMO1 | 2326 | RNAseq | 1.6357 | 0.0000 | |
| SRP159526 | FMO1 | 2326 | RNAseq | -0.1915 | 0.7772 | |
| SRP219564 | FMO1 | 2326 | RNAseq | 2.2732 | 0.0005 | |
| TCGA | FMO1 | 2326 | RNAseq | 1.3017 | 0.0000 |
Upregulated datasets: 5; Downregulated datasets: 0.
Survival by FMO1 expression:
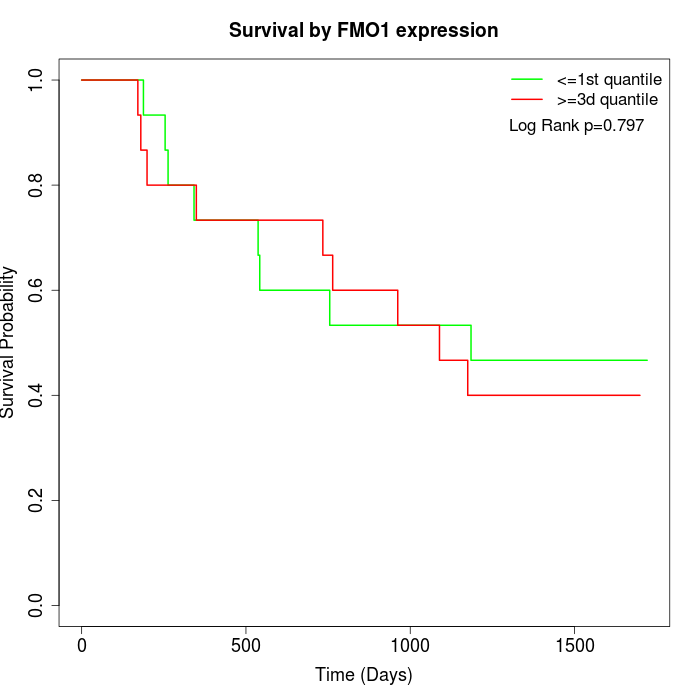 | 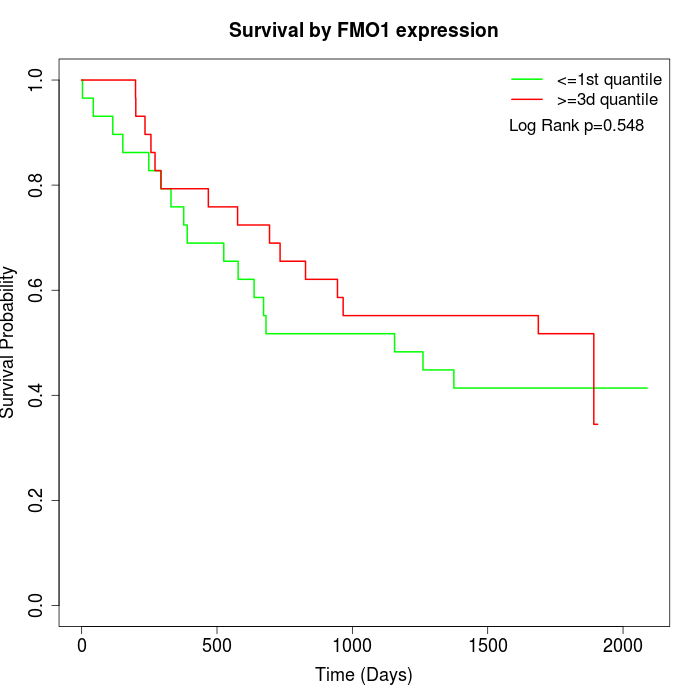 | 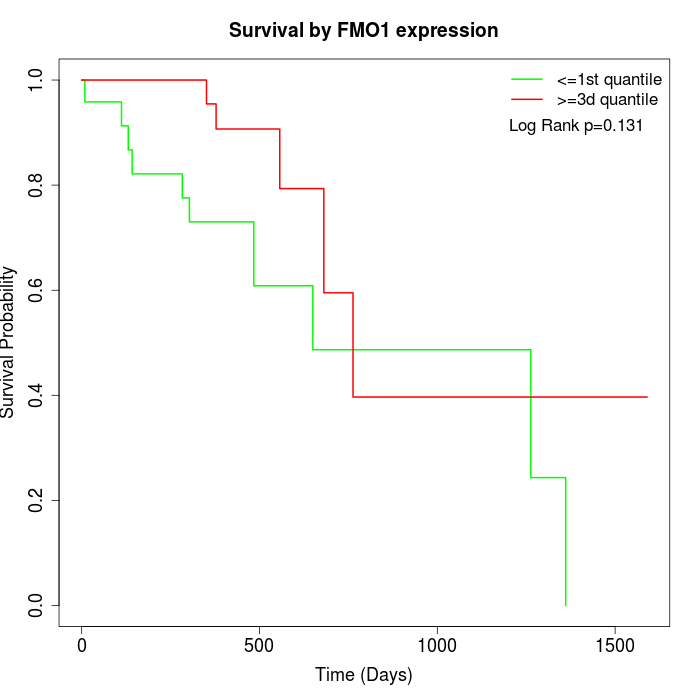 |
| GSE53622 | GSE53624 | TCGA |
Note: Click image to view full size file.
Copy number change of FMO1:
| Dataset | Gene | EntrezID | Gain | Loss | Normal | Detail |
|---|---|---|---|---|---|---|
| GSE15526 | FMO1 | 2326 | 12 | 1 | 17 | |
| GSE20123 | FMO1 | 2326 | 12 | 1 | 17 | |
| GSE43470 | FMO1 | 2326 | 7 | 2 | 34 | |
| GSE46452 | FMO1 | 2326 | 3 | 1 | 55 | |
| GSE47630 | FMO1 | 2326 | 14 | 0 | 26 | |
| GSE54993 | FMO1 | 2326 | 0 | 6 | 64 | |
| GSE54994 | FMO1 | 2326 | 16 | 0 | 37 | |
| GSE60625 | FMO1 | 2326 | 0 | 0 | 11 | |
| GSE74703 | FMO1 | 2326 | 7 | 2 | 27 | |
| GSE74704 | FMO1 | 2326 | 6 | 0 | 14 | |
| TCGA | FMO1 | 2326 | 43 | 3 | 50 |
Total number of gains: 120; Total number of losses: 16; Total Number of normals: 352.
Somatic mutations of FMO1:
Generating mutation plots.
Highly correlated genes for FMO1:
Showing top 20/85 corelated genes with mean PCC>0.5.
| Gene1 | Gene2 | Mean PCC | Num. Datasets | Num. PCC<0 | Num. PCC>0.5 |
|---|---|---|---|---|---|
| FMO1 | GPR84 | 0.662199 | 4 | 0 | 3 |
| FMO1 | SLC41A2 | 0.656764 | 3 | 0 | 3 |
| FMO1 | CFI | 0.636035 | 4 | 0 | 4 |
| FMO1 | PPIP5K2 | 0.628365 | 3 | 0 | 3 |
| FMO1 | SEMA6A | 0.623348 | 3 | 0 | 3 |
| FMO1 | KIF16B | 0.616142 | 3 | 0 | 3 |
| FMO1 | PDZD11 | 0.610129 | 4 | 0 | 4 |
| FMO1 | VKORC1 | 0.60969 | 4 | 0 | 3 |
| FMO1 | WDR41 | 0.608862 | 3 | 0 | 3 |
| FMO1 | FCGR2C | 0.608679 | 4 | 0 | 3 |
| FMO1 | FN3KRP | 0.604762 | 3 | 0 | 3 |
| FMO1 | CCNK | 0.602198 | 3 | 0 | 3 |
| FMO1 | LARS2 | 0.600716 | 3 | 0 | 3 |
| FMO1 | SNX6 | 0.598524 | 3 | 0 | 3 |
| FMO1 | GUCY1A2 | 0.596994 | 4 | 0 | 3 |
| FMO1 | ENC1 | 0.590772 | 5 | 0 | 3 |
| FMO1 | PEAK1 | 0.590566 | 3 | 0 | 3 |
| FMO1 | SIRPA | 0.587709 | 4 | 0 | 3 |
| FMO1 | P2RY13 | 0.587377 | 5 | 0 | 3 |
| FMO1 | ITPA | 0.586876 | 4 | 0 | 3 |
For details and further investigation, click here