| Full name: growth arrest specific 5 | Alias Symbol: SNHG2|NCRNA00030 | ||
| Type: non-coding RNA | Cytoband: 1q25.1 | ||
| Entrez ID: 60674 | HGNC ID: HGNC:16355 | Ensembl Gene: ENSG00000234741 | OMIM ID: 608280 |
Expression of GAS5:
| Dataset | Gene | EntrezID | Probe | Log2FC | Adj.pValue | Expression |
|---|---|---|---|---|---|---|
| GSE17351 | GAS5 | 60674 | 1560402_at | 0.0057 | 0.9879 | |
| GSE26886 | GAS5 | 60674 | 1560402_at | 0.5855 | 0.0102 | |
| GSE45670 | GAS5 | 60674 | 1560402_at | -0.0078 | 0.9566 | |
| GSE53622 | GAS5 | 60674 | 19317 | -0.0777 | 0.4271 | |
| GSE53624 | GAS5 | 60674 | 59445 | 0.1678 | 0.0096 | |
| GSE63941 | GAS5 | 60674 | 1560402_at | 1.1783 | 0.0075 | |
| GSE77861 | GAS5 | 60674 | 1560402_at | 0.0506 | 0.6505 | |
| SRP007169 | GAS5 | 60674 | RNAseq | -0.9412 | 0.0493 | |
| SRP008496 | GAS5 | 60674 | RNAseq | -0.6127 | 0.0209 | |
| SRP064894 | GAS5 | 60674 | RNAseq | -0.2469 | 0.3862 | |
| SRP133303 | GAS5 | 60674 | RNAseq | -0.1590 | 0.3962 | |
| SRP159526 | GAS5 | 60674 | RNAseq | -0.4555 | 0.0975 | |
| SRP193095 | GAS5 | 60674 | RNAseq | -0.5645 | 0.0009 | |
| SRP219564 | GAS5 | 60674 | RNAseq | 0.2960 | 0.6153 | |
| TCGA | GAS5 | 60674 | RNAseq | 0.2027 | 0.0024 |
Upregulated datasets: 1; Downregulated datasets: 0.
Survival by GAS5 expression:
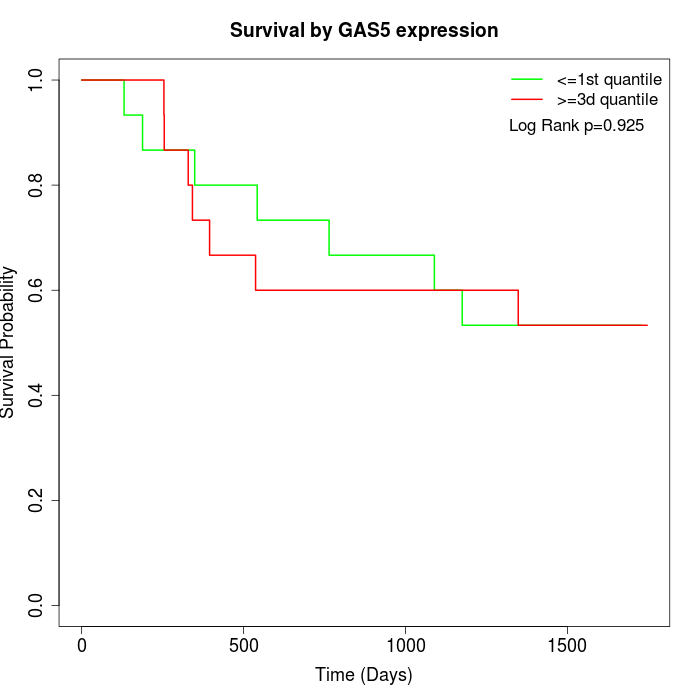 | 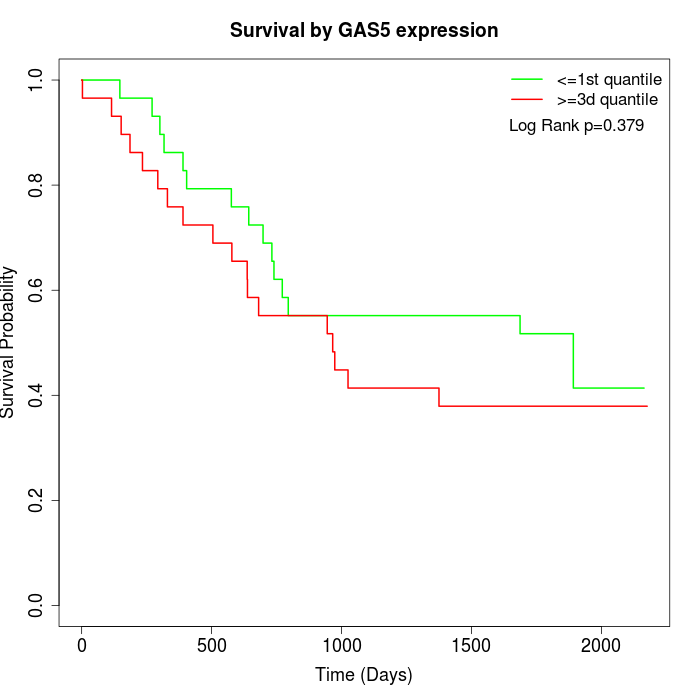 | 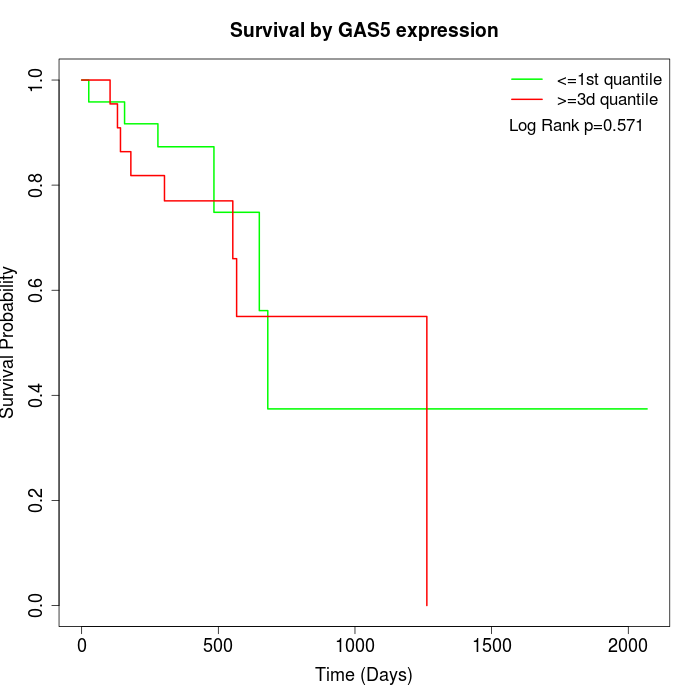 |
| GSE53622 | GSE53624 | TCGA |
Note: Click image to view full size file.
Copy number change of GAS5:
| Dataset | Gene | EntrezID | Gain | Loss | Normal | Detail |
|---|---|---|---|---|---|---|
| GSE15526 | GAS5 | 60674 | 12 | 0 | 18 | |
| GSE20123 | GAS5 | 60674 | 12 | 0 | 18 | |
| GSE43470 | GAS5 | 60674 | 7 | 2 | 34 | |
| GSE46452 | GAS5 | 60674 | 3 | 1 | 55 | |
| GSE47630 | GAS5 | 60674 | 14 | 0 | 26 | |
| GSE54993 | GAS5 | 60674 | 0 | 6 | 64 | |
| GSE54994 | GAS5 | 60674 | 15 | 0 | 38 | |
| GSE60625 | GAS5 | 60674 | 0 | 0 | 11 | |
| GSE74703 | GAS5 | 60674 | 7 | 2 | 27 | |
| GSE74704 | GAS5 | 60674 | 5 | 0 | 15 | |
| TCGA | GAS5 | 60674 | 42 | 3 | 51 |
Total number of gains: 117; Total number of losses: 14; Total Number of normals: 357.
Somatic mutations of GAS5:
Generating mutation plots.
Highly correlated genes for GAS5:
Showing all 18 correlated genes with mean PCC>0.5.
| Gene1 | Gene2 | Mean PCC | Num. Datasets | Num. PCC<0 | Num. PCC>0.5 |
|---|---|---|---|---|---|
| GAS5 | GATC | 0.641392 | 3 | 0 | 3 |
| GAS5 | TTF1 | 0.638195 | 4 | 0 | 4 |
| GAS5 | RPS15A | 0.635067 | 3 | 0 | 3 |
| GAS5 | SLC19A2 | 0.621985 | 3 | 0 | 3 |
| GAS5 | MYC | 0.609437 | 3 | 0 | 3 |
| GAS5 | PPP1R15B | 0.606653 | 3 | 0 | 3 |
| GAS5 | ZNF57 | 0.600734 | 3 | 0 | 3 |
| GAS5 | SECISBP2 | 0.596731 | 3 | 0 | 3 |
| GAS5 | ZFAS1 | 0.588225 | 5 | 0 | 4 |
| GAS5 | DNAJC24 | 0.57985 | 4 | 0 | 3 |
| GAS5 | TIMM9 | 0.579743 | 3 | 0 | 3 |
| GAS5 | HNRNPA1 | 0.575565 | 4 | 0 | 4 |
| GAS5 | RPS27 | 0.57026 | 5 | 0 | 4 |
| GAS5 | TIGD1 | 0.568256 | 4 | 0 | 3 |
| GAS5 | ACTR3B | 0.565272 | 3 | 0 | 3 |
| GAS5 | SMYD5 | 0.55111 | 3 | 0 | 3 |
| GAS5 | COCH | 0.54046 | 4 | 0 | 3 |
| GAS5 | RPS7 | 0.534795 | 5 | 0 | 3 |
For details and further investigation, click here