| Full name: transcription termination factor 1 | Alias Symbol: | ||
| Type: protein-coding gene | Cytoband: 9q34.13 | ||
| Entrez ID: 7270 | HGNC ID: HGNC:12397 | Ensembl Gene: ENSG00000125482 | OMIM ID: 600777 |
Screen Evidence:
| |||
TTF1 involved pathways:
| KEGG pathway | Description | View |
|---|---|---|
| hsa04918 | Thyroid hormone synthesis |
Expression of TTF1:
| Dataset | Gene | EntrezID | Probe | Log2FC | Adj.pValue | Expression |
|---|---|---|---|---|---|---|
| GSE17351 | TTF1 | 7270 | 204771_s_at | 0.0807 | 0.9135 | |
| GSE20347 | TTF1 | 7270 | 204771_s_at | 0.3985 | 0.0150 | |
| GSE23400 | TTF1 | 7270 | 204771_s_at | 0.4293 | 0.0000 | |
| GSE26886 | TTF1 | 7270 | 204771_s_at | 1.2119 | 0.0000 | |
| GSE29001 | TTF1 | 7270 | 204771_s_at | 0.7132 | 0.0028 | |
| GSE38129 | TTF1 | 7270 | 204771_s_at | 0.3665 | 0.0053 | |
| GSE45670 | TTF1 | 7270 | 204771_s_at | 0.5266 | 0.0001 | |
| GSE53622 | TTF1 | 7270 | 119532 | 0.1729 | 0.0066 | |
| GSE53624 | TTF1 | 7270 | 119532 | 0.2976 | 0.0000 | |
| GSE63941 | TTF1 | 7270 | 204771_s_at | 1.4771 | 0.0009 | |
| GSE77861 | TTF1 | 7270 | 204771_s_at | 0.7981 | 0.0036 | |
| GSE97050 | TTF1 | 7270 | A_33_P3230339 | 0.0217 | 0.9216 | |
| SRP007169 | TTF1 | 7270 | RNAseq | 1.0039 | 0.0531 | |
| SRP008496 | TTF1 | 7270 | RNAseq | 0.8385 | 0.0616 | |
| SRP064894 | TTF1 | 7270 | RNAseq | 0.3750 | 0.0079 | |
| SRP133303 | TTF1 | 7270 | RNAseq | 0.0746 | 0.5333 | |
| SRP159526 | TTF1 | 7270 | RNAseq | 0.3289 | 0.1691 | |
| SRP193095 | TTF1 | 7270 | RNAseq | 0.2016 | 0.0380 | |
| SRP219564 | TTF1 | 7270 | RNAseq | -0.1771 | 0.6019 | |
| TCGA | TTF1 | 7270 | RNAseq | 0.0620 | 0.3016 |
Upregulated datasets: 2; Downregulated datasets: 0.
Survival by TTF1 expression:
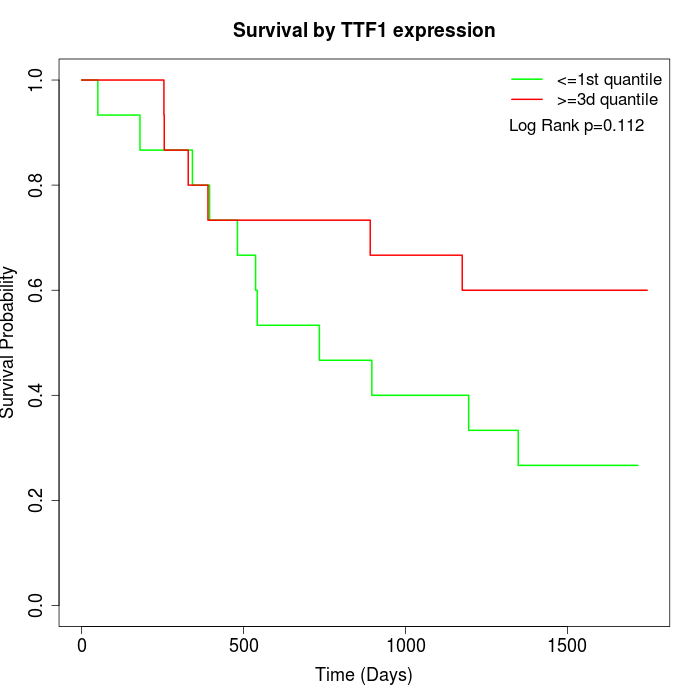 | 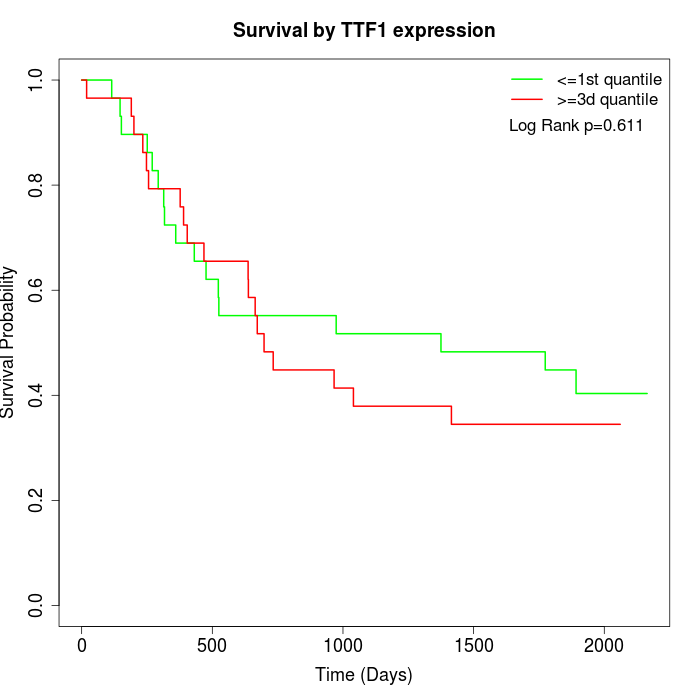 | 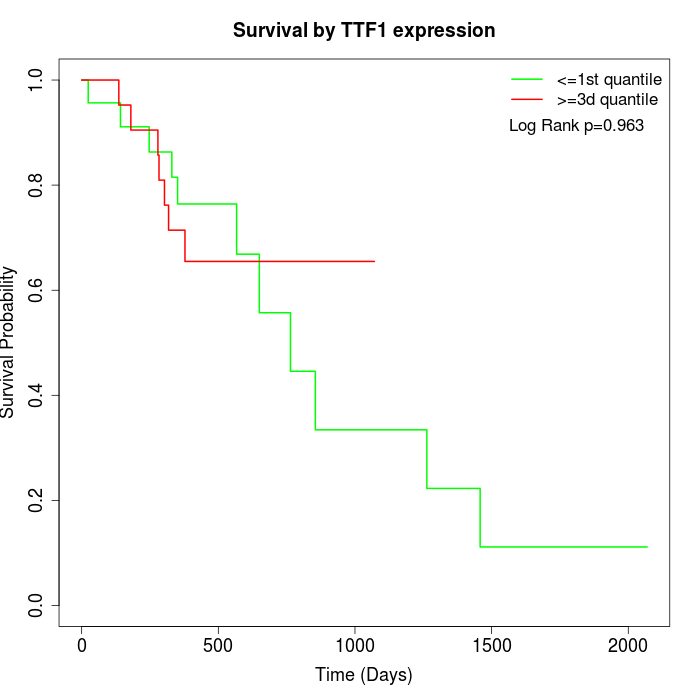 |
| GSE53622 | GSE53624 | TCGA |
Note: Click image to view full size file.
Copy number change of TTF1:
| Dataset | Gene | EntrezID | Gain | Loss | Normal | Detail |
|---|---|---|---|---|---|---|
| GSE15526 | TTF1 | 7270 | 6 | 7 | 17 | |
| GSE20123 | TTF1 | 7270 | 6 | 7 | 17 | |
| GSE43470 | TTF1 | 7270 | 4 | 7 | 32 | |
| GSE46452 | TTF1 | 7270 | 6 | 13 | 40 | |
| GSE47630 | TTF1 | 7270 | 4 | 15 | 21 | |
| GSE54993 | TTF1 | 7270 | 3 | 3 | 64 | |
| GSE54994 | TTF1 | 7270 | 12 | 9 | 32 | |
| GSE60625 | TTF1 | 7270 | 0 | 0 | 11 | |
| GSE74703 | TTF1 | 7270 | 4 | 5 | 27 | |
| GSE74704 | TTF1 | 7270 | 4 | 5 | 11 | |
| TCGA | TTF1 | 7270 | 28 | 26 | 42 |
Total number of gains: 77; Total number of losses: 97; Total Number of normals: 314.
Somatic mutations of TTF1:
Generating mutation plots.
Highly correlated genes for TTF1:
Showing top 20/1075 corelated genes with mean PCC>0.5.
| Gene1 | Gene2 | Mean PCC | Num. Datasets | Num. PCC<0 | Num. PCC>0.5 |
|---|---|---|---|---|---|
| TTF1 | ANAPC4 | 0.817631 | 3 | 0 | 3 |
| TTF1 | GNA13 | 0.794058 | 3 | 0 | 3 |
| TTF1 | HES4 | 0.792765 | 3 | 0 | 3 |
| TTF1 | SNAPC2 | 0.789465 | 3 | 0 | 3 |
| TTF1 | UHRF1BP1 | 0.741908 | 3 | 0 | 3 |
| TTF1 | PACSIN2 | 0.737932 | 3 | 0 | 3 |
| TTF1 | PLEKHH1 | 0.736057 | 4 | 0 | 4 |
| TTF1 | LTBR | 0.735118 | 3 | 0 | 3 |
| TTF1 | ZNF362 | 0.729853 | 3 | 0 | 3 |
| TTF1 | ALKBH6 | 0.728489 | 5 | 0 | 4 |
| TTF1 | MYH3 | 0.72485 | 3 | 0 | 3 |
| TTF1 | MAPK1IP1L | 0.720667 | 3 | 0 | 3 |
| TTF1 | ZZEF1 | 0.720503 | 3 | 0 | 3 |
| TTF1 | PPP6R2 | 0.715955 | 3 | 0 | 3 |
| TTF1 | STRN4 | 0.715343 | 3 | 0 | 3 |
| TTF1 | CLUH | 0.714276 | 3 | 0 | 3 |
| TTF1 | FH | 0.71183 | 3 | 0 | 3 |
| TTF1 | PITPNB | 0.710152 | 3 | 0 | 3 |
| TTF1 | MAP3K2 | 0.710004 | 6 | 0 | 5 |
| TTF1 | ELOVL7 | 0.706066 | 3 | 0 | 3 |
For details and further investigation, click here