| Full name: growth factor independent 1B transcriptional repressor | Alias Symbol: ZNF163B | ||
| Type: protein-coding gene | Cytoband: 9q34.13 | ||
| Entrez ID: 8328 | HGNC ID: HGNC:4238 | Ensembl Gene: ENSG00000165702 | OMIM ID: 604383 |
Expression of GFI1B:
| Dataset | Gene | EntrezID | Probe | Log2FC | Adj.pValue | Expression |
|---|---|---|---|---|---|---|
| GSE17351 | GFI1B | 8328 | 237403_at | -0.0540 | 0.8278 | |
| GSE20347 | GFI1B | 8328 | 208501_at | -0.0740 | 0.2161 | |
| GSE23400 | GFI1B | 8328 | 208501_at | -0.1159 | 0.0000 | |
| GSE26886 | GFI1B | 8328 | 237403_at | 0.0256 | 0.8671 | |
| GSE29001 | GFI1B | 8328 | 208501_at | -0.0275 | 0.8306 | |
| GSE38129 | GFI1B | 8328 | 208501_at | -0.0445 | 0.3902 | |
| GSE45670 | GFI1B | 8328 | 237403_at | 0.1829 | 0.1367 | |
| GSE53622 | GFI1B | 8328 | 52346 | 0.3178 | 0.0000 | |
| GSE53624 | GFI1B | 8328 | 52346 | 0.1932 | 0.0243 | |
| GSE63941 | GFI1B | 8328 | 237403_at | 0.0042 | 0.9808 | |
| GSE77861 | GFI1B | 8328 | 237403_at | -0.0027 | 0.9858 | |
| SRP133303 | GFI1B | 8328 | RNAseq | 0.1864 | 0.3622 | |
| SRP159526 | GFI1B | 8328 | RNAseq | 0.4168 | 0.5507 | |
| SRP193095 | GFI1B | 8328 | RNAseq | -0.1380 | 0.3927 | |
| TCGA | GFI1B | 8328 | RNAseq | -1.5090 | 0.1972 |
Upregulated datasets: 0; Downregulated datasets: 0.
Survival by GFI1B expression:
 |  | 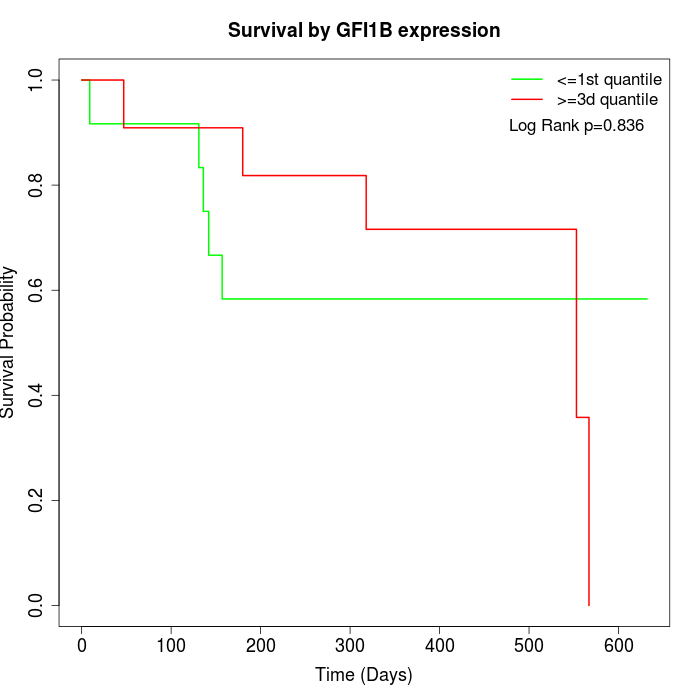 |
| GSE53622 | GSE53624 | TCGA |
Note: Click image to view full size file.
Copy number change of GFI1B:
| Dataset | Gene | EntrezID | Gain | Loss | Normal | Detail |
|---|---|---|---|---|---|---|
| GSE15526 | GFI1B | 8328 | 5 | 7 | 18 | |
| GSE20123 | GFI1B | 8328 | 5 | 7 | 18 | |
| GSE43470 | GFI1B | 8328 | 4 | 7 | 32 | |
| GSE46452 | GFI1B | 8328 | 6 | 13 | 40 | |
| GSE47630 | GFI1B | 8328 | 4 | 15 | 21 | |
| GSE54993 | GFI1B | 8328 | 3 | 3 | 64 | |
| GSE54994 | GFI1B | 8328 | 12 | 9 | 32 | |
| GSE60625 | GFI1B | 8328 | 0 | 0 | 11 | |
| GSE74703 | GFI1B | 8328 | 4 | 5 | 27 | |
| GSE74704 | GFI1B | 8328 | 3 | 5 | 12 | |
| TCGA | GFI1B | 8328 | 28 | 26 | 42 |
Total number of gains: 74; Total number of losses: 97; Total Number of normals: 317.
Somatic mutations of GFI1B:
Generating mutation plots.
Highly correlated genes for GFI1B:
Showing top 20/371 corelated genes with mean PCC>0.5.
| Gene1 | Gene2 | Mean PCC | Num. Datasets | Num. PCC<0 | Num. PCC>0.5 |
|---|---|---|---|---|---|
| GFI1B | GNRH2 | 0.697974 | 3 | 0 | 3 |
| GFI1B | ZNF460 | 0.668439 | 4 | 0 | 3 |
| GFI1B | CEND1 | 0.666003 | 4 | 0 | 4 |
| GFI1B | MSH4 | 0.664608 | 3 | 0 | 3 |
| GFI1B | OVOL3 | 0.658835 | 5 | 0 | 5 |
| GFI1B | SLC9A5 | 0.654365 | 3 | 0 | 3 |
| GFI1B | VGF | 0.650043 | 3 | 0 | 3 |
| GFI1B | TERT | 0.64944 | 3 | 0 | 3 |
| GFI1B | CNTD2 | 0.647752 | 4 | 0 | 3 |
| GFI1B | LZTS1 | 0.646053 | 4 | 0 | 4 |
| GFI1B | KCNC4 | 0.643511 | 4 | 0 | 4 |
| GFI1B | LINC00474 | 0.638298 | 3 | 0 | 3 |
| GFI1B | SLC6A12 | 0.636114 | 3 | 0 | 3 |
| GFI1B | DNAAF1 | 0.633836 | 3 | 0 | 3 |
| GFI1B | PVR | 0.633492 | 3 | 0 | 3 |
| GFI1B | KIAA1614 | 0.631581 | 3 | 0 | 3 |
| GFI1B | CDON | 0.63128 | 3 | 0 | 3 |
| GFI1B | SLC26A1 | 0.630207 | 3 | 0 | 3 |
| GFI1B | CAPN11 | 0.628918 | 3 | 0 | 3 |
| GFI1B | SLC22A13 | 0.627758 | 3 | 0 | 3 |
For details and further investigation, click here