| Full name: geranylgeranyl diphosphate synthase 1 | Alias Symbol: GGPPS1 | ||
| Type: protein-coding gene | Cytoband: 1q42.3 | ||
| Entrez ID: 9453 | HGNC ID: HGNC:4249 | Ensembl Gene: ENSG00000152904 | OMIM ID: 606982 |
| Related drugs: CHEMBL259026, CHEMBL262616, CHEMBL291314, CHEMBL411274, CHEMBL416301, CHEMBL419627, CHEMBL493443, CHEMBL494896, CHEMBL494897, CHEMBL495315... [more] | |||
Screen Evidence:
| |||
Expression of GGPS1:
| Dataset | Gene | EntrezID | Probe | Log2FC | Adj.pValue | Expression |
|---|---|---|---|---|---|---|
| GSE17351 | GGPS1 | 9453 | 202322_s_at | 0.3130 | 0.2407 | |
| GSE20347 | GGPS1 | 9453 | 202322_s_at | 0.2854 | 0.0113 | |
| GSE23400 | GGPS1 | 9453 | 202322_s_at | 0.2720 | 0.0000 | |
| GSE26886 | GGPS1 | 9453 | 202322_s_at | 0.4055 | 0.0057 | |
| GSE29001 | GGPS1 | 9453 | 202322_s_at | 0.3671 | 0.1655 | |
| GSE38129 | GGPS1 | 9453 | 202322_s_at | 0.2774 | 0.0025 | |
| GSE45670 | GGPS1 | 9453 | 202322_s_at | 0.0533 | 0.6763 | |
| GSE53622 | GGPS1 | 9453 | 49997 | -0.3354 | 0.0005 | |
| GSE53624 | GGPS1 | 9453 | 131392 | 0.1536 | 0.2396 | |
| GSE63941 | GGPS1 | 9453 | 202322_s_at | 0.5431 | 0.1995 | |
| GSE77861 | GGPS1 | 9453 | 202322_s_at | 0.1903 | 0.3021 | |
| GSE97050 | GGPS1 | 9453 | A_33_P3258041 | -0.2452 | 0.3948 | |
| SRP007169 | GGPS1 | 9453 | RNAseq | -0.1397 | 0.6920 | |
| SRP008496 | GGPS1 | 9453 | RNAseq | -0.1453 | 0.5964 | |
| SRP064894 | GGPS1 | 9453 | RNAseq | 0.1078 | 0.4059 | |
| SRP133303 | GGPS1 | 9453 | RNAseq | 0.2630 | 0.0540 | |
| SRP159526 | GGPS1 | 9453 | RNAseq | -0.0815 | 0.7831 | |
| SRP193095 | GGPS1 | 9453 | RNAseq | -0.0839 | 0.3805 | |
| SRP219564 | GGPS1 | 9453 | RNAseq | -0.1607 | 0.5761 | |
| TCGA | GGPS1 | 9453 | RNAseq | 0.0253 | 0.6233 |
Upregulated datasets: 0; Downregulated datasets: 0.
Survival by GGPS1 expression:
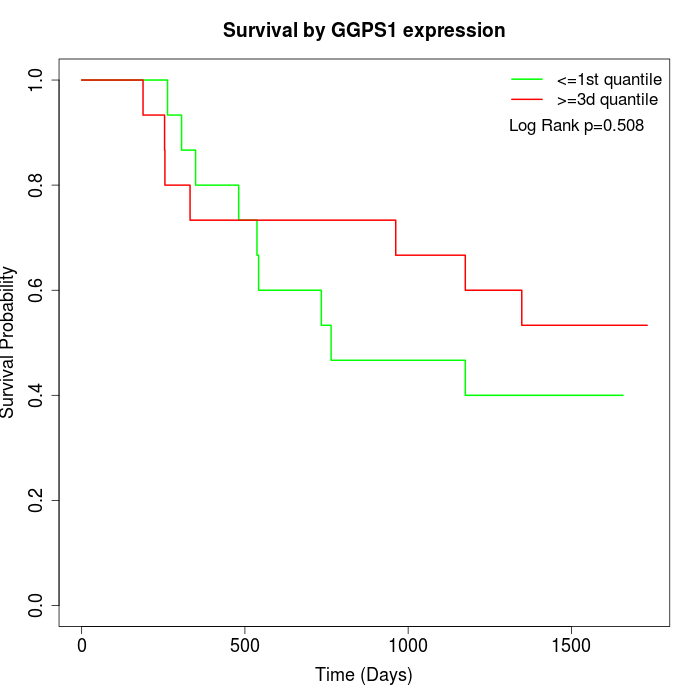 | 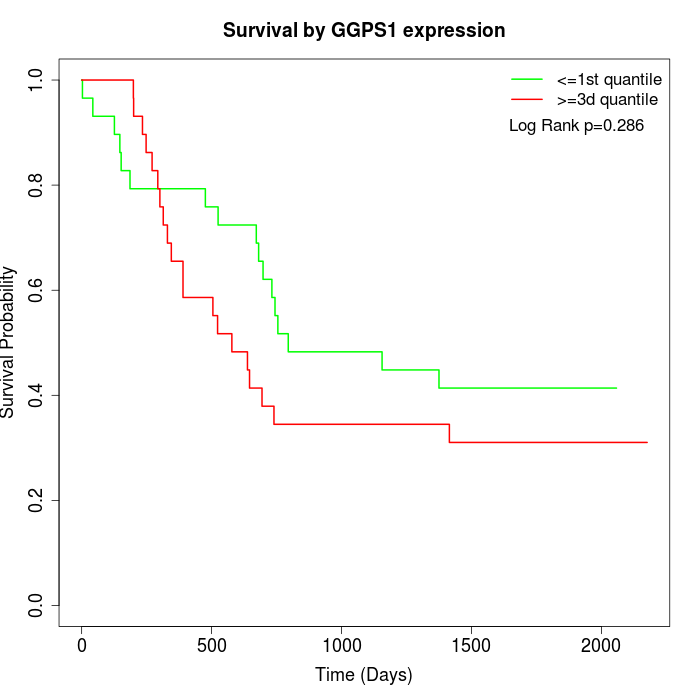 | 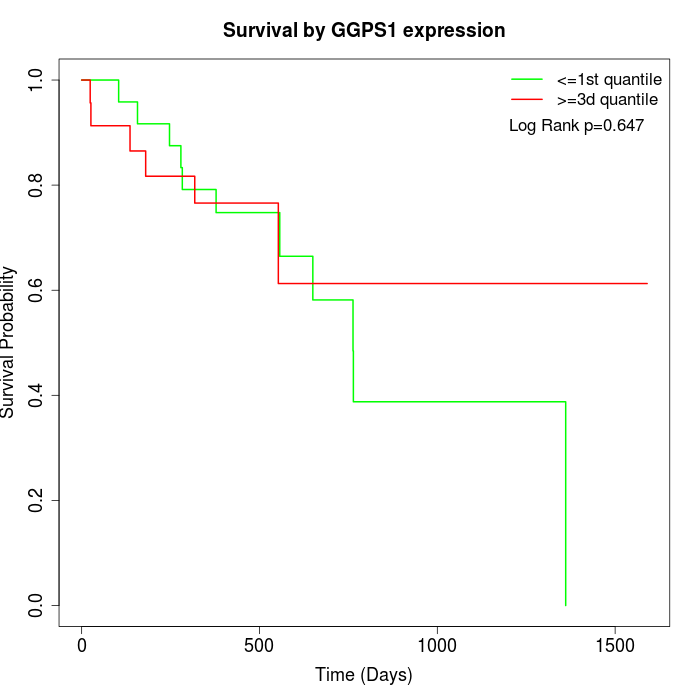 |
| GSE53622 | GSE53624 | TCGA |
Note: Click image to view full size file.
Copy number change of GGPS1:
| Dataset | Gene | EntrezID | Gain | Loss | Normal | Detail |
|---|---|---|---|---|---|---|
| GSE15526 | GGPS1 | 9453 | 10 | 0 | 20 | |
| GSE20123 | GGPS1 | 9453 | 11 | 0 | 19 | |
| GSE43470 | GGPS1 | 9453 | 8 | 1 | 34 | |
| GSE46452 | GGPS1 | 9453 | 4 | 2 | 53 | |
| GSE47630 | GGPS1 | 9453 | 15 | 0 | 25 | |
| GSE54993 | GGPS1 | 9453 | 0 | 6 | 64 | |
| GSE54994 | GGPS1 | 9453 | 16 | 0 | 37 | |
| GSE60625 | GGPS1 | 9453 | 0 | 0 | 11 | |
| GSE74703 | GGPS1 | 9453 | 8 | 1 | 27 | |
| GSE74704 | GGPS1 | 9453 | 5 | 0 | 15 | |
| TCGA | GGPS1 | 9453 | 44 | 3 | 49 |
Total number of gains: 121; Total number of losses: 13; Total Number of normals: 354.
Somatic mutations of GGPS1:
Generating mutation plots.
Highly correlated genes for GGPS1:
Showing top 20/749 corelated genes with mean PCC>0.5.
| Gene1 | Gene2 | Mean PCC | Num. Datasets | Num. PCC<0 | Num. PCC>0.5 |
|---|---|---|---|---|---|
| GGPS1 | LRRC58 | 0.81632 | 3 | 0 | 3 |
| GGPS1 | RP9 | 0.810992 | 3 | 0 | 3 |
| GGPS1 | MRPS26 | 0.778818 | 3 | 0 | 3 |
| GGPS1 | TEAD2 | 0.77551 | 3 | 0 | 3 |
| GGPS1 | UHRF1BP1 | 0.773326 | 3 | 0 | 3 |
| GGPS1 | COMMD7 | 0.760799 | 3 | 0 | 3 |
| GGPS1 | MRPS6 | 0.758977 | 3 | 0 | 3 |
| GGPS1 | ZNF124 | 0.757281 | 3 | 0 | 3 |
| GGPS1 | RNF4 | 0.748454 | 3 | 0 | 3 |
| GGPS1 | ZFX | 0.743769 | 3 | 0 | 3 |
| GGPS1 | ZNF672 | 0.742458 | 3 | 0 | 3 |
| GGPS1 | TSNARE1 | 0.740649 | 3 | 0 | 3 |
| GGPS1 | NAPEPLD | 0.736866 | 4 | 0 | 4 |
| GGPS1 | CEBPZ | 0.728991 | 4 | 0 | 4 |
| GGPS1 | RPTOR | 0.722538 | 4 | 0 | 3 |
| GGPS1 | LYAR | 0.721673 | 3 | 0 | 3 |
| GGPS1 | ANKRD46 | 0.72116 | 4 | 0 | 4 |
| GGPS1 | TFDP2 | 0.72087 | 3 | 0 | 3 |
| GGPS1 | NOM1 | 0.720715 | 4 | 0 | 3 |
| GGPS1 | HMG20A | 0.720625 | 3 | 0 | 3 |
For details and further investigation, click here