| Full name: G protein-coupled receptor 88 | Alias Symbol: | ||
| Type: protein-coding gene | Cytoband: 1p21.2 | ||
| Entrez ID: 54112 | HGNC ID: HGNC:4539 | Ensembl Gene: ENSG00000181656 | OMIM ID: 607468 |
Expression of GPR88:
| Dataset | Gene | EntrezID | Probe | Log2FC | Adj.pValue | Expression |
|---|---|---|---|---|---|---|
| GSE17351 | GPR88 | 54112 | 220313_at | -0.2525 | 0.5549 | |
| GSE20347 | GPR88 | 54112 | 220313_at | -0.0322 | 0.5213 | |
| GSE23400 | GPR88 | 54112 | 220313_at | -0.0205 | 0.3551 | |
| GSE26886 | GPR88 | 54112 | 220313_at | -0.0117 | 0.8990 | |
| GSE29001 | GPR88 | 54112 | 220313_at | 0.0149 | 0.9062 | |
| GSE38129 | GPR88 | 54112 | 220313_at | -0.1246 | 0.0326 | |
| GSE45670 | GPR88 | 54112 | 220313_at | -0.0515 | 0.7335 | |
| GSE53622 | GPR88 | 54112 | 46860 | 0.1428 | 0.0394 | |
| GSE53624 | GPR88 | 54112 | 46860 | 0.3157 | 0.0000 | |
| GSE63941 | GPR88 | 54112 | 220313_at | -0.4932 | 0.0028 | |
| GSE77861 | GPR88 | 54112 | 220313_at | 0.0107 | 0.9178 | |
| GSE97050 | GPR88 | 54112 | A_33_P3380462 | -0.1401 | 0.6140 | |
| TCGA | GPR88 | 54112 | RNAseq | -1.1578 | 0.0377 |
Upregulated datasets: 0; Downregulated datasets: 1.
Survival by GPR88 expression:
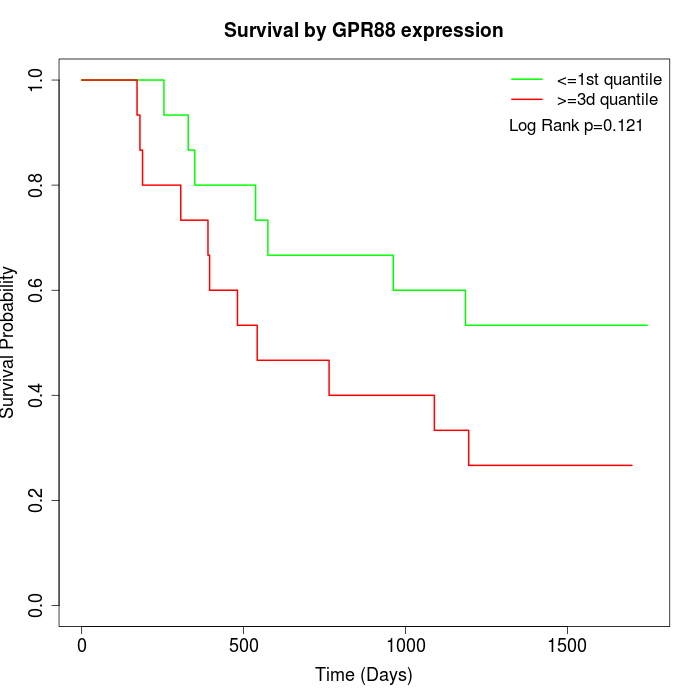 | 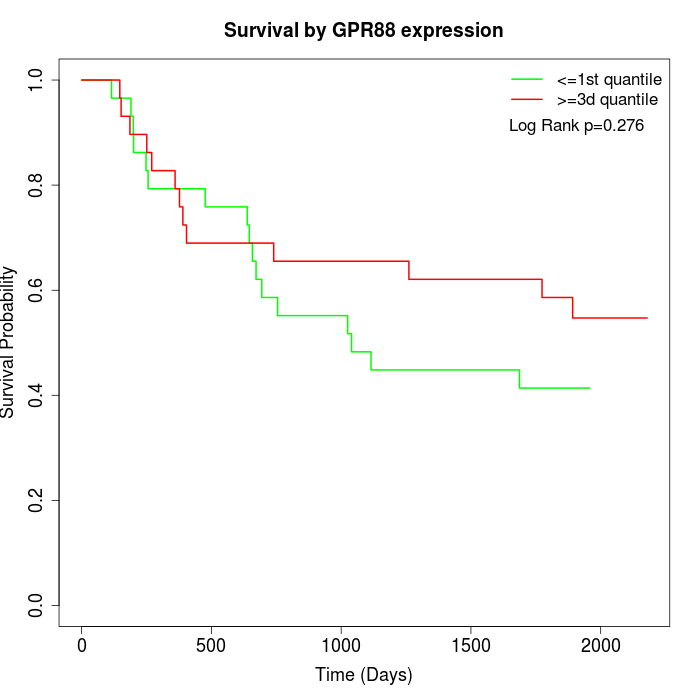 | 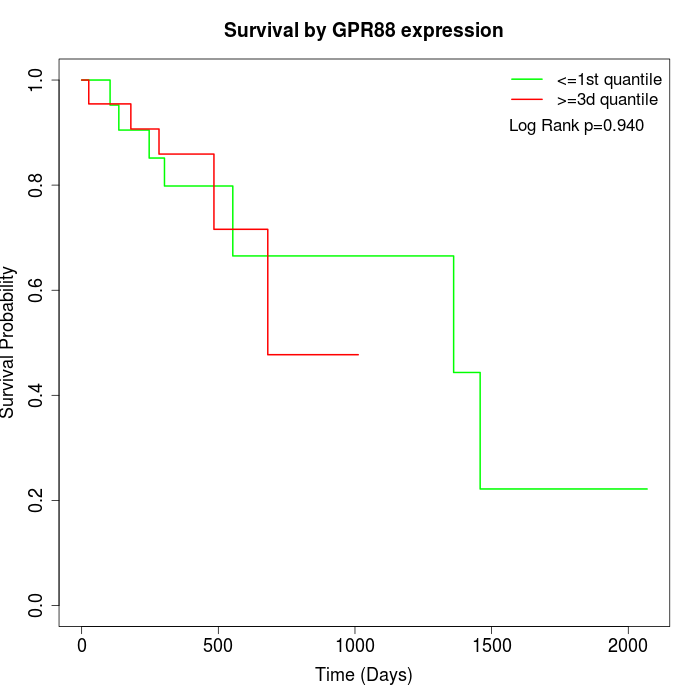 |
| GSE53622 | GSE53624 | TCGA |
Note: Click image to view full size file.
Copy number change of GPR88:
| Dataset | Gene | EntrezID | Gain | Loss | Normal | Detail |
|---|---|---|---|---|---|---|
| GSE15526 | GPR88 | 54112 | 0 | 10 | 20 | |
| GSE20123 | GPR88 | 54112 | 0 | 10 | 20 | |
| GSE43470 | GPR88 | 54112 | 2 | 6 | 35 | |
| GSE46452 | GPR88 | 54112 | 1 | 1 | 57 | |
| GSE47630 | GPR88 | 54112 | 9 | 5 | 26 | |
| GSE54993 | GPR88 | 54112 | 0 | 1 | 69 | |
| GSE54994 | GPR88 | 54112 | 6 | 3 | 44 | |
| GSE60625 | GPR88 | 54112 | 0 | 0 | 11 | |
| GSE74703 | GPR88 | 54112 | 1 | 5 | 30 | |
| GSE74704 | GPR88 | 54112 | 0 | 6 | 14 | |
| TCGA | GPR88 | 54112 | 8 | 25 | 63 |
Total number of gains: 27; Total number of losses: 72; Total Number of normals: 389.
Somatic mutations of GPR88:
Generating mutation plots.
Highly correlated genes for GPR88:
Showing top 20/218 corelated genes with mean PCC>0.5.
| Gene1 | Gene2 | Mean PCC | Num. Datasets | Num. PCC<0 | Num. PCC>0.5 |
|---|---|---|---|---|---|
| GPR88 | FSIP1 | 0.809126 | 3 | 0 | 3 |
| GPR88 | HRC | 0.776673 | 4 | 0 | 4 |
| GPR88 | TRIM10 | 0.752113 | 4 | 0 | 4 |
| GPR88 | C2CD4D | 0.745263 | 3 | 0 | 3 |
| GPR88 | CHD5 | 0.739408 | 6 | 0 | 6 |
| GPR88 | CALML6 | 0.733309 | 3 | 0 | 3 |
| GPR88 | SOX3 | 0.729198 | 3 | 0 | 3 |
| GPR88 | FAM181A | 0.727888 | 3 | 0 | 3 |
| GPR88 | PENK | 0.721183 | 4 | 0 | 3 |
| GPR88 | GABRA5 | 0.720767 | 4 | 0 | 3 |
| GPR88 | CRYGC | 0.719376 | 3 | 0 | 3 |
| GPR88 | FBRSL1 | 0.718529 | 3 | 0 | 3 |
| GPR88 | DNAH9 | 0.711075 | 3 | 0 | 3 |
| GPR88 | GNB3 | 0.707045 | 4 | 0 | 4 |
| GPR88 | LRTM1 | 0.705355 | 3 | 0 | 3 |
| GPR88 | SLC10A1 | 0.703613 | 3 | 0 | 3 |
| GPR88 | PKLR | 0.700833 | 4 | 0 | 4 |
| GPR88 | FRMD1 | 0.700753 | 3 | 0 | 3 |
| GPR88 | CDH10 | 0.699367 | 4 | 0 | 3 |
| GPR88 | C20orf144 | 0.698393 | 3 | 0 | 3 |
For details and further investigation, click here