| Full name: proenkephalin | Alias Symbol: | ||
| Type: protein-coding gene | Cytoband: 8q12.1 | ||
| Entrez ID: 5179 | HGNC ID: HGNC:8831 | Ensembl Gene: ENSG00000181195 | OMIM ID: 131330 |
Expression of PENK:
| Dataset | Gene | EntrezID | Probe | Log2FC | Adj.pValue | Expression |
|---|---|---|---|---|---|---|
| GSE17351 | PENK | 5179 | 213791_at | -1.3107 | 0.3490 | |
| GSE20347 | PENK | 5179 | 213791_at | -0.0599 | 0.5731 | |
| GSE23400 | PENK | 5179 | 213791_at | -0.3407 | 0.0000 | |
| GSE26886 | PENK | 5179 | 237774_at | -0.1685 | 0.2015 | |
| GSE29001 | PENK | 5179 | 213791_at | -0.4981 | 0.0418 | |
| GSE38129 | PENK | 5179 | 213791_at | -0.4530 | 0.1679 | |
| GSE45670 | PENK | 5179 | 237774_at | -0.0764 | 0.4704 | |
| GSE53622 | PENK | 5179 | 94829 | -0.1981 | 0.2182 | |
| GSE53624 | PENK | 5179 | 94829 | -0.2676 | 0.0356 | |
| GSE63941 | PENK | 5179 | 237774_at | 0.1512 | 0.3210 | |
| GSE77861 | PENK | 5179 | 237774_at | -0.0961 | 0.2534 | |
| GSE97050 | PENK | 5179 | A_23_P417918 | -0.2226 | 0.4873 | |
| SRP159526 | PENK | 5179 | RNAseq | 4.0441 | 0.0000 | |
| TCGA | PENK | 5179 | RNAseq | -0.7066 | 0.2667 |
Upregulated datasets: 1; Downregulated datasets: 0.
Survival by PENK expression:
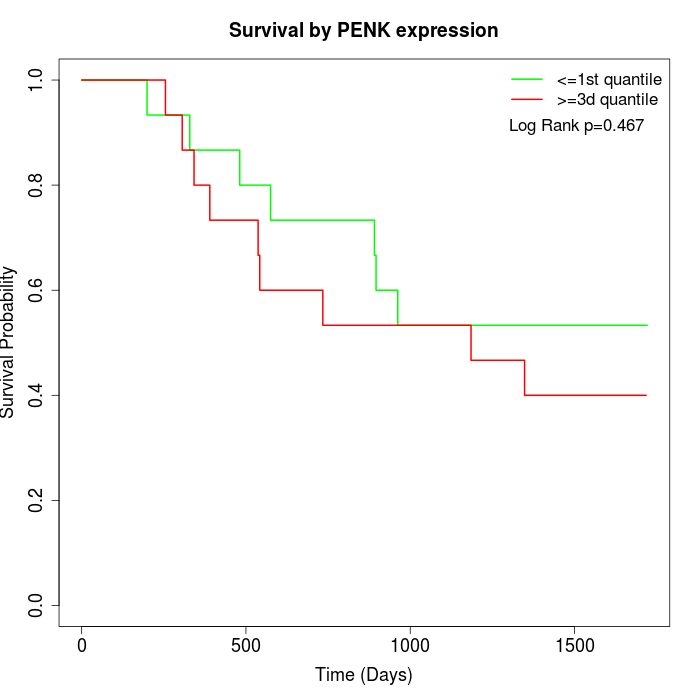 | 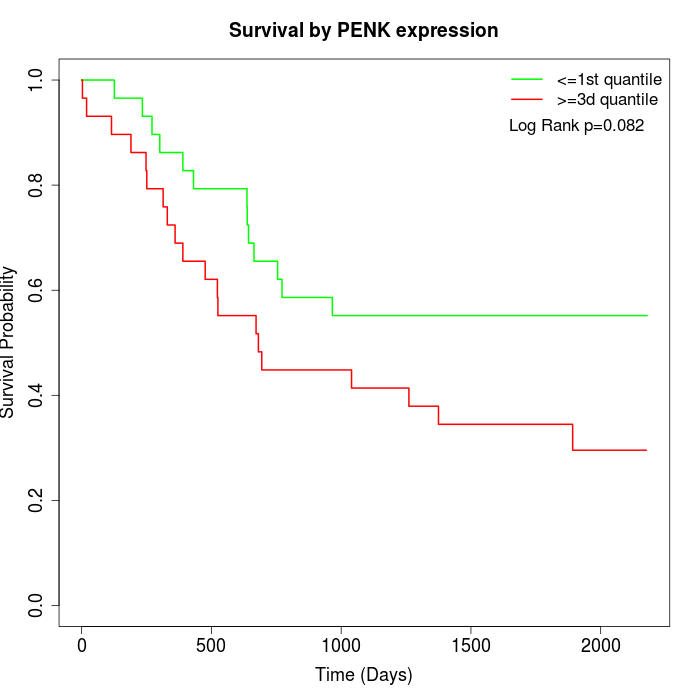 | 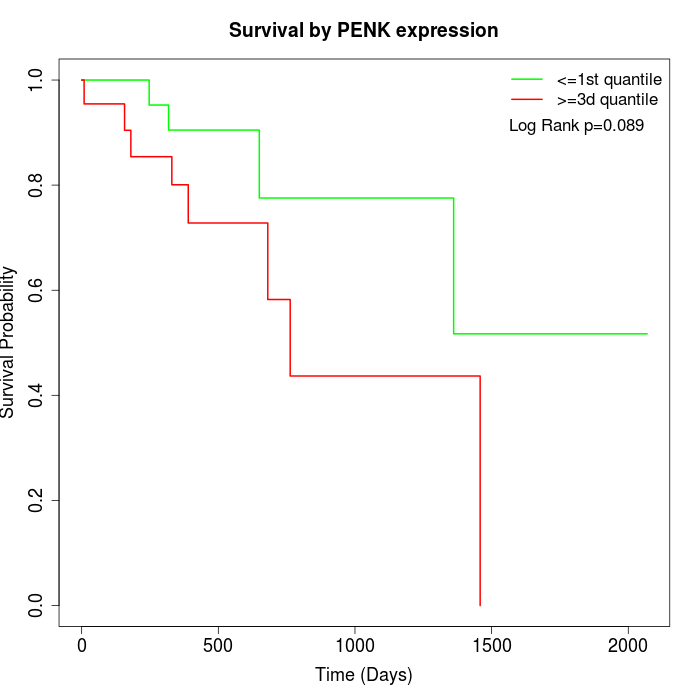 |
| GSE53622 | GSE53624 | TCGA |
Note: Click image to view full size file.
Copy number change of PENK:
| Dataset | Gene | EntrezID | Gain | Loss | Normal | Detail |
|---|---|---|---|---|---|---|
| GSE15526 | PENK | 5179 | 14 | 1 | 15 | |
| GSE20123 | PENK | 5179 | 14 | 1 | 15 | |
| GSE43470 | PENK | 5179 | 13 | 3 | 27 | |
| GSE46452 | PENK | 5179 | 20 | 3 | 36 | |
| GSE47630 | PENK | 5179 | 23 | 1 | 16 | |
| GSE54993 | PENK | 5179 | 1 | 17 | 52 | |
| GSE54994 | PENK | 5179 | 29 | 0 | 24 | |
| GSE60625 | PENK | 5179 | 0 | 4 | 7 | |
| GSE74703 | PENK | 5179 | 12 | 2 | 22 | |
| GSE74704 | PENK | 5179 | 10 | 0 | 10 | |
| TCGA | PENK | 5179 | 43 | 8 | 45 |
Total number of gains: 179; Total number of losses: 40; Total Number of normals: 269.
Somatic mutations of PENK:
Generating mutation plots.
Highly correlated genes for PENK:
Showing top 20/239 corelated genes with mean PCC>0.5.
| Gene1 | Gene2 | Mean PCC | Num. Datasets | Num. PCC<0 | Num. PCC>0.5 |
|---|---|---|---|---|---|
| PENK | ANKDD1A | 0.759776 | 3 | 0 | 3 |
| PENK | TRPM8 | 0.725941 | 4 | 0 | 4 |
| PENK | GPR88 | 0.721183 | 4 | 0 | 3 |
| PENK | ZNF491 | 0.69705 | 4 | 0 | 4 |
| PENK | SCARA5 | 0.693549 | 3 | 0 | 3 |
| PENK | CSRP1 | 0.6779 | 4 | 0 | 3 |
| PENK | DKKL1 | 0.677773 | 3 | 0 | 3 |
| PENK | EPHA7 | 0.673268 | 4 | 0 | 4 |
| PENK | WFS1 | 0.672422 | 4 | 0 | 4 |
| PENK | OPTC | 0.671115 | 3 | 0 | 3 |
| PENK | LRRC18 | 0.669691 | 3 | 0 | 3 |
| PENK | ITGB1BP2 | 0.669097 | 6 | 0 | 5 |
| PENK | DLK1 | 0.658827 | 4 | 0 | 3 |
| PENK | S100A4 | 0.655427 | 3 | 0 | 3 |
| PENK | NACAD | 0.655292 | 6 | 0 | 4 |
| PENK | KLK3 | 0.654178 | 4 | 0 | 3 |
| PENK | HTR2B | 0.654059 | 4 | 0 | 3 |
| PENK | CDH2 | 0.653121 | 4 | 0 | 3 |
| PENK | GPR62 | 0.650805 | 3 | 0 | 3 |
| PENK | SMPX | 0.64762 | 7 | 0 | 6 |
For details and further investigation, click here