| Full name: growth factor receptor bound protein 10 | Alias Symbol: | ||
| Type: protein-coding gene | Cytoband: 7p12.1 | ||
| Entrez ID: 2887 | HGNC ID: HGNC:4564 | Ensembl Gene: ENSG00000106070 | OMIM ID: 601523 |
GRB10 involved pathways:
| KEGG pathway | Description | View |
|---|---|---|
| hsa04150 | mTOR signaling pathway |
Expression of GRB10:
| Dataset | Gene | EntrezID | Probe | Log2FC | Adj.pValue | Expression |
|---|---|---|---|---|---|---|
| GSE17351 | GRB10 | 2887 | 209409_at | -0.0714 | 0.9438 | |
| GSE20347 | GRB10 | 2887 | 209409_at | 1.1688 | 0.0001 | |
| GSE23400 | GRB10 | 2887 | 209409_at | 0.7406 | 0.0000 | |
| GSE26886 | GRB10 | 2887 | 209409_at | 1.5453 | 0.0000 | |
| GSE29001 | GRB10 | 2887 | 209409_at | 0.4807 | 0.2336 | |
| GSE38129 | GRB10 | 2887 | 209409_at | 0.9608 | 0.0002 | |
| GSE45670 | GRB10 | 2887 | 209409_at | 0.3774 | 0.2329 | |
| GSE53622 | GRB10 | 2887 | 44559 | 0.4166 | 0.0010 | |
| GSE53624 | GRB10 | 2887 | 44559 | 0.8467 | 0.0000 | |
| GSE63941 | GRB10 | 2887 | 209409_at | -0.6458 | 0.7721 | |
| GSE77861 | GRB10 | 2887 | 209409_at | 1.4968 | 0.0137 | |
| GSE97050 | GRB10 | 2887 | A_23_P122863 | 0.7626 | 0.2491 | |
| SRP007169 | GRB10 | 2887 | RNAseq | 3.0238 | 0.0000 | |
| SRP008496 | GRB10 | 2887 | RNAseq | 2.9566 | 0.0000 | |
| SRP064894 | GRB10 | 2887 | RNAseq | 0.9603 | 0.0000 | |
| SRP133303 | GRB10 | 2887 | RNAseq | 1.1263 | 0.0000 | |
| SRP159526 | GRB10 | 2887 | RNAseq | 1.2726 | 0.0024 | |
| SRP193095 | GRB10 | 2887 | RNAseq | 1.1993 | 0.0000 | |
| SRP219564 | GRB10 | 2887 | RNAseq | 0.5634 | 0.1521 | |
| TCGA | GRB10 | 2887 | RNAseq | -0.0705 | 0.4106 |
Upregulated datasets: 8; Downregulated datasets: 0.
Survival by GRB10 expression:
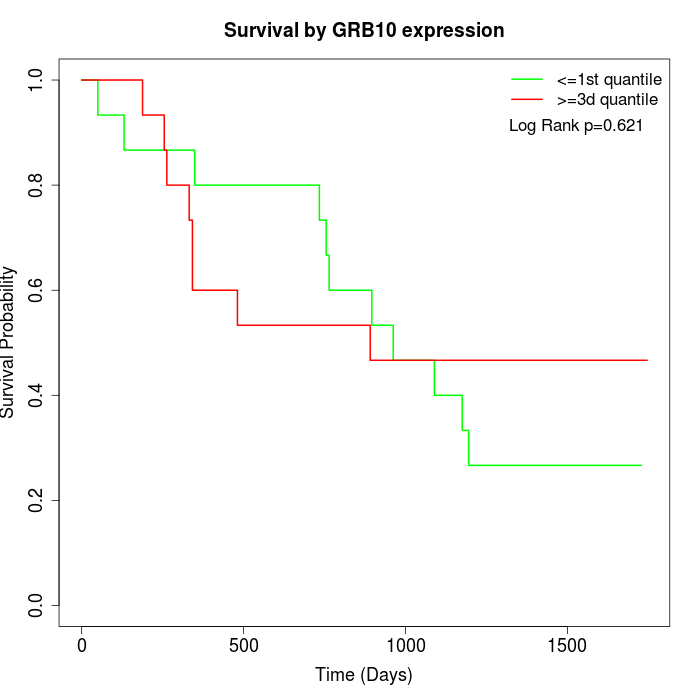 | 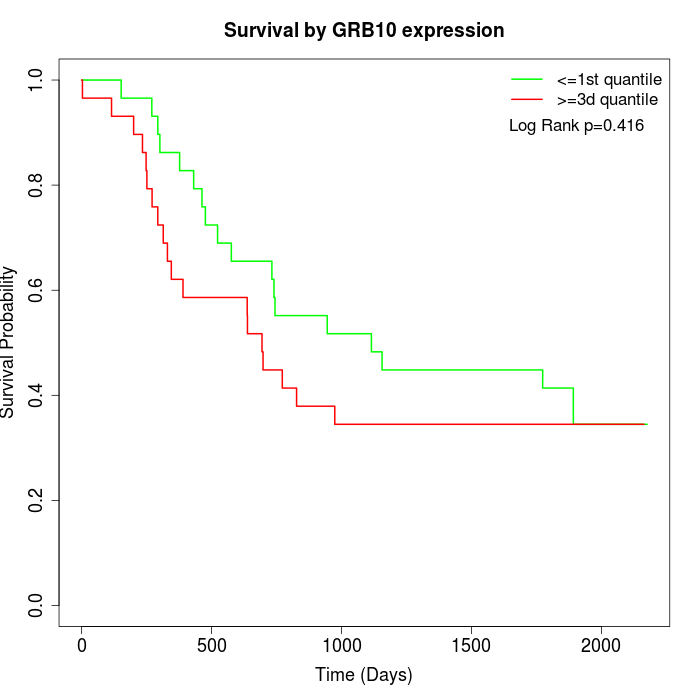 | 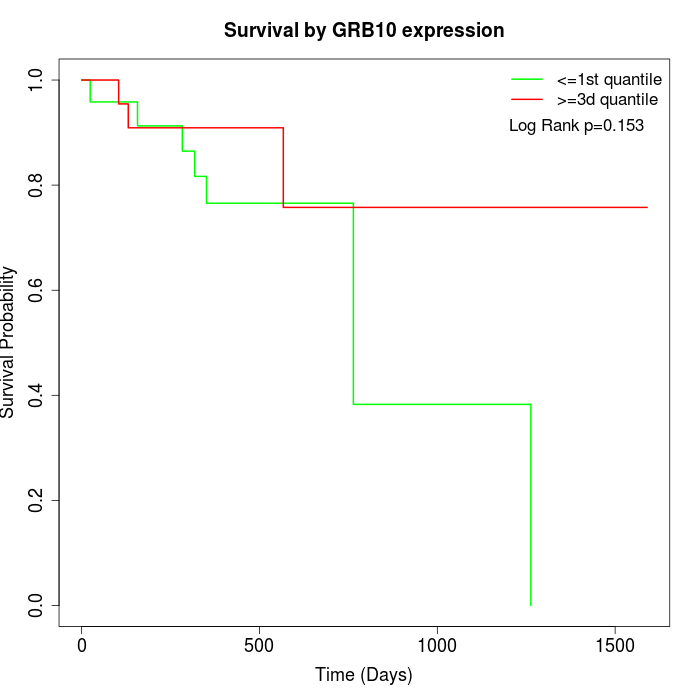 |
| GSE53622 | GSE53624 | TCGA |
Note: Click image to view full size file.
Copy number change of GRB10:
| Dataset | Gene | EntrezID | Gain | Loss | Normal | Detail |
|---|---|---|---|---|---|---|
| GSE15526 | GRB10 | 2887 | 12 | 0 | 18 | |
| GSE20123 | GRB10 | 2887 | 11 | 0 | 19 | |
| GSE43470 | GRB10 | 2887 | 4 | 1 | 38 | |
| GSE46452 | GRB10 | 2887 | 11 | 1 | 47 | |
| GSE47630 | GRB10 | 2887 | 8 | 1 | 31 | |
| GSE54993 | GRB10 | 2887 | 0 | 8 | 62 | |
| GSE54994 | GRB10 | 2887 | 18 | 2 | 33 | |
| GSE60625 | GRB10 | 2887 | 0 | 0 | 11 | |
| GSE74703 | GRB10 | 2887 | 4 | 1 | 31 | |
| GSE74704 | GRB10 | 2887 | 5 | 0 | 15 | |
| TCGA | GRB10 | 2887 | 48 | 10 | 38 |
Total number of gains: 121; Total number of losses: 24; Total Number of normals: 343.
Somatic mutations of GRB10:
Generating mutation plots.
Highly correlated genes for GRB10:
Showing top 20/1320 corelated genes with mean PCC>0.5.
| Gene1 | Gene2 | Mean PCC | Num. Datasets | Num. PCC<0 | Num. PCC>0.5 |
|---|---|---|---|---|---|
| GRB10 | DNM1L | 0.763553 | 3 | 0 | 3 |
| GRB10 | RILPL1 | 0.763355 | 3 | 0 | 3 |
| GRB10 | SEC22C | 0.761916 | 4 | 0 | 4 |
| GRB10 | SPIRE1 | 0.734964 | 4 | 0 | 3 |
| GRB10 | SGTB | 0.734071 | 4 | 0 | 4 |
| GRB10 | DOCK11 | 0.73058 | 5 | 0 | 4 |
| GRB10 | TAOK1 | 0.728169 | 3 | 0 | 3 |
| GRB10 | PDE7A | 0.72034 | 4 | 0 | 3 |
| GRB10 | SCCPDH | 0.708274 | 10 | 0 | 10 |
| GRB10 | TNFAIP1 | 0.706282 | 3 | 0 | 3 |
| GRB10 | FADS1 | 0.705074 | 3 | 0 | 3 |
| GRB10 | DNAJC18 | 0.704576 | 3 | 0 | 3 |
| GRB10 | CEP290 | 0.704231 | 8 | 0 | 8 |
| GRB10 | ERRFI1 | 0.69549 | 3 | 0 | 3 |
| GRB10 | WDR81 | 0.693628 | 4 | 0 | 4 |
| GRB10 | CENPV | 0.6936 | 6 | 0 | 5 |
| GRB10 | PRTFDC1 | 0.693066 | 7 | 0 | 6 |
| GRB10 | CNTD1 | 0.692984 | 3 | 0 | 3 |
| GRB10 | LAMB1 | 0.692645 | 10 | 0 | 10 |
| GRB10 | PXDN | 0.69259 | 11 | 0 | 11 |
For details and further investigation, click here