| Full name: G2 and S-phase expressed 1 | Alias Symbol: GTSE-1|B99 | ||
| Type: protein-coding gene | Cytoband: 22q13.31 | ||
| Entrez ID: 51512 | HGNC ID: HGNC:13698 | Ensembl Gene: ENSG00000075218 | OMIM ID: 607477 |
Screen Evidence:
| |||
GTSE1 involved pathways:
| KEGG pathway | Description | View |
|---|---|---|
| hsa04115 | p53 signaling pathway |
Expression of GTSE1:
| Dataset | Gene | EntrezID | Probe | Log2FC | Adj.pValue | Expression |
|---|---|---|---|---|---|---|
| GSE17351 | GTSE1 | 51512 | 211040_x_at | 0.6948 | 0.1188 | |
| GSE20347 | GTSE1 | 51512 | 211040_x_at | 0.5292 | 0.0001 | |
| GSE23400 | GTSE1 | 51512 | 211040_x_at | 0.2757 | 0.0000 | |
| GSE26886 | GTSE1 | 51512 | 211040_x_at | 0.7399 | 0.0002 | |
| GSE29001 | GTSE1 | 51512 | 211040_x_at | 0.6236 | 0.0079 | |
| GSE38129 | GTSE1 | 51512 | 211040_x_at | 0.6066 | 0.0000 | |
| GSE45670 | GTSE1 | 51512 | 211040_x_at | 0.3680 | 0.0015 | |
| GSE53622 | GTSE1 | 51512 | 2264 | 2.2058 | 0.0000 | |
| GSE53624 | GTSE1 | 51512 | 2264 | 2.2625 | 0.0000 | |
| GSE63941 | GTSE1 | 51512 | 211040_x_at | 0.2508 | 0.3901 | |
| GSE77861 | GTSE1 | 51512 | 211040_x_at | 0.6048 | 0.0082 | |
| GSE97050 | GTSE1 | 51512 | A_23_P57588 | 1.2930 | 0.1344 | |
| SRP007169 | GTSE1 | 51512 | RNAseq | 2.2553 | 0.0001 | |
| SRP008496 | GTSE1 | 51512 | RNAseq | 2.2377 | 0.0000 | |
| SRP064894 | GTSE1 | 51512 | RNAseq | 2.1505 | 0.0000 | |
| SRP133303 | GTSE1 | 51512 | RNAseq | 1.3848 | 0.0000 | |
| SRP159526 | GTSE1 | 51512 | RNAseq | 1.7642 | 0.0001 | |
| SRP193095 | GTSE1 | 51512 | RNAseq | 0.9642 | 0.0000 | |
| SRP219564 | GTSE1 | 51512 | RNAseq | 1.4887 | 0.0458 | |
| TCGA | GTSE1 | 51512 | RNAseq | 1.2374 | 0.0000 |
Upregulated datasets: 9; Downregulated datasets: 0.
Survival by GTSE1 expression:
 |  | 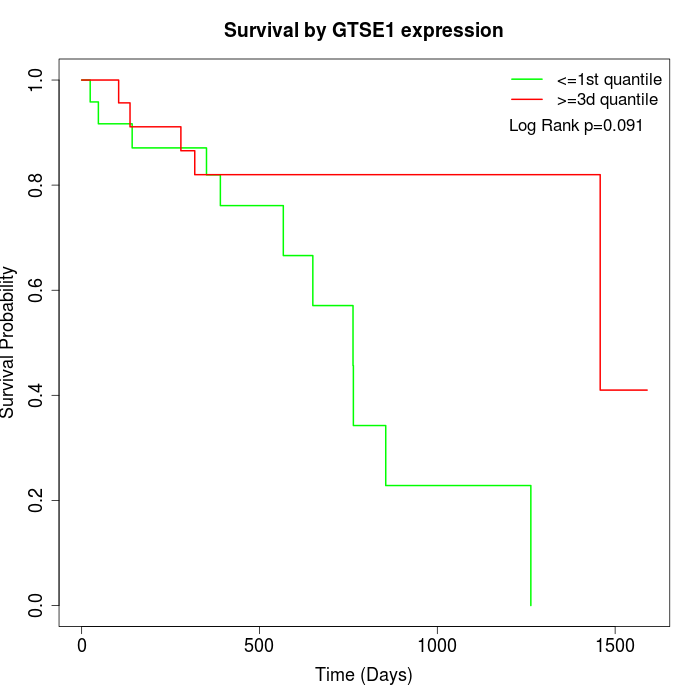 |
| GSE53622 | GSE53624 | TCGA |
Note: Click image to view full size file.
Copy number change of GTSE1:
| Dataset | Gene | EntrezID | Gain | Loss | Normal | Detail |
|---|---|---|---|---|---|---|
| GSE15526 | GTSE1 | 51512 | 5 | 6 | 19 | |
| GSE20123 | GTSE1 | 51512 | 4 | 5 | 21 | |
| GSE43470 | GTSE1 | 51512 | 2 | 6 | 35 | |
| GSE46452 | GTSE1 | 51512 | 31 | 2 | 26 | |
| GSE47630 | GTSE1 | 51512 | 9 | 4 | 27 | |
| GSE54993 | GTSE1 | 51512 | 3 | 6 | 61 | |
| GSE54994 | GTSE1 | 51512 | 11 | 7 | 35 | |
| GSE60625 | GTSE1 | 51512 | 5 | 0 | 6 | |
| GSE74703 | GTSE1 | 51512 | 2 | 4 | 30 | |
| GSE74704 | GTSE1 | 51512 | 2 | 3 | 15 | |
| TCGA | GTSE1 | 51512 | 27 | 15 | 54 |
Total number of gains: 101; Total number of losses: 58; Total Number of normals: 329.
Somatic mutations of GTSE1:
Generating mutation plots.
Highly correlated genes for GTSE1:
Showing top 20/1744 corelated genes with mean PCC>0.5.
| Gene1 | Gene2 | Mean PCC | Num. Datasets | Num. PCC<0 | Num. PCC>0.5 |
|---|---|---|---|---|---|
| GTSE1 | CMBL | 0.860729 | 4 | 0 | 4 |
| GTSE1 | PRR11 | 0.845871 | 12 | 0 | 11 |
| GTSE1 | ZNF721 | 0.826521 | 8 | 0 | 8 |
| GTSE1 | MZT2B | 0.810699 | 9 | 0 | 9 |
| GTSE1 | KLHL24 | 0.782844 | 7 | 0 | 7 |
| GTSE1 | MTBP | 0.775212 | 5 | 0 | 5 |
| GTSE1 | SH2B2 | 0.772268 | 9 | 0 | 9 |
| GTSE1 | ZNF160 | 0.76835 | 8 | 0 | 8 |
| GTSE1 | PNPT1 | 0.76472 | 6 | 0 | 6 |
| GTSE1 | SLC35E1 | 0.76303 | 9 | 0 | 8 |
| GTSE1 | NLN | 0.762879 | 7 | 0 | 7 |
| GTSE1 | DKC1 | 0.754101 | 3 | 0 | 3 |
| GTSE1 | UHRF1 | 0.75045 | 8 | 0 | 8 |
| GTSE1 | FUT8-AS1 | 0.749657 | 4 | 0 | 4 |
| GTSE1 | CMSS1 | 0.74384 | 6 | 0 | 6 |
| GTSE1 | DDX59 | 0.740355 | 5 | 0 | 4 |
| GTSE1 | ZNF611 | 0.739284 | 8 | 0 | 8 |
| GTSE1 | ORC6 | 0.738538 | 11 | 0 | 11 |
| GTSE1 | MMS22L | 0.736993 | 3 | 0 | 3 |
| GTSE1 | NOP58 | 0.736034 | 7 | 0 | 7 |
For details and further investigation, click here