| Full name: HAUS augmin like complex subunit 3 | Alias Symbol: MGC4701|IT1|dgt3 | ||
| Type: protein-coding gene | Cytoband: 4p16.3 | ||
| Entrez ID: 79441 | HGNC ID: HGNC:28719 | Ensembl Gene: ENSG00000214367 | OMIM ID: 613430 |
Screen Evidence:
| |||
Expression of HAUS3:
| Dataset | Gene | EntrezID | Probe | Log2FC | Adj.pValue | Expression |
|---|---|---|---|---|---|---|
| GSE17351 | HAUS3 | 79441 | 210054_at | 0.3247 | 0.4150 | |
| GSE20347 | HAUS3 | 79441 | 210054_at | 0.1617 | 0.3249 | |
| GSE23400 | HAUS3 | 79441 | 210054_at | 0.2489 | 0.0000 | |
| GSE26886 | HAUS3 | 79441 | 210054_at | 0.2948 | 0.4002 | |
| GSE29001 | HAUS3 | 79441 | 210054_at | 0.1944 | 0.7000 | |
| GSE38129 | HAUS3 | 79441 | 210054_at | 0.2473 | 0.0187 | |
| GSE45670 | HAUS3 | 79441 | 210054_at | 0.0405 | 0.7713 | |
| GSE53622 | HAUS3 | 79441 | 43205 | -0.4656 | 0.0000 | |
| GSE53624 | HAUS3 | 79441 | 43205 | -0.1135 | 0.2132 | |
| GSE63941 | HAUS3 | 79441 | 210054_at | 0.6700 | 0.0955 | |
| GSE77861 | HAUS3 | 79441 | 210054_at | 0.1950 | 0.4856 | |
| GSE97050 | HAUS3 | 79441 | A_33_P3385062 | -0.0179 | 0.9387 | |
| SRP007169 | HAUS3 | 79441 | RNAseq | 0.0888 | 0.8508 | |
| SRP008496 | HAUS3 | 79441 | RNAseq | -0.1000 | 0.7054 | |
| SRP064894 | HAUS3 | 79441 | RNAseq | 0.1273 | 0.5563 | |
| SRP133303 | HAUS3 | 79441 | RNAseq | 0.0358 | 0.6944 | |
| SRP159526 | HAUS3 | 79441 | RNAseq | -0.0692 | 0.6863 | |
| SRP193095 | HAUS3 | 79441 | RNAseq | -0.1628 | 0.0440 | |
| SRP219564 | HAUS3 | 79441 | RNAseq | 0.0084 | 0.9818 | |
| TCGA | HAUS3 | 79441 | RNAseq | -0.0188 | 0.7437 |
Upregulated datasets: 0; Downregulated datasets: 0.
Survival by HAUS3 expression:
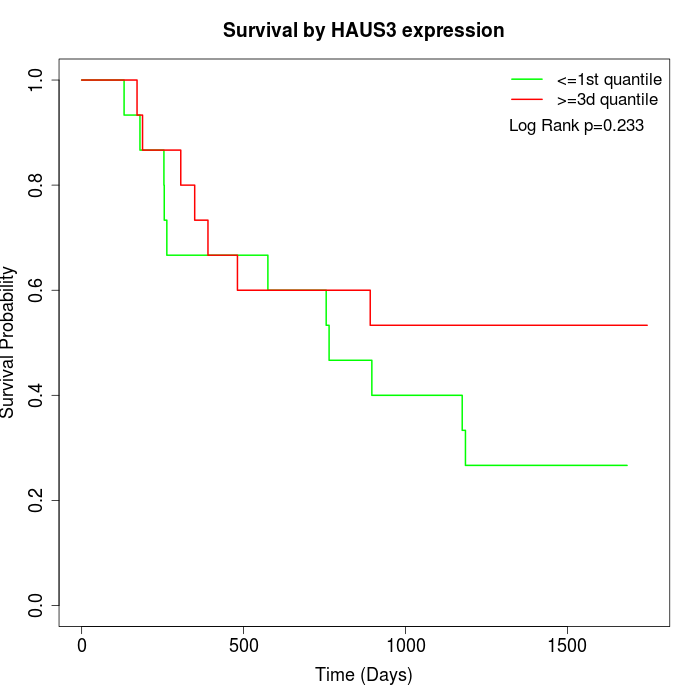 | 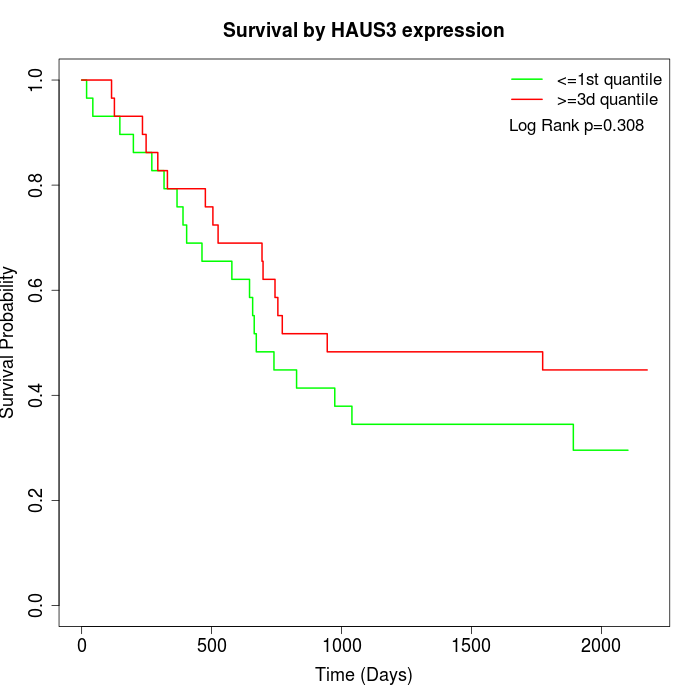 | 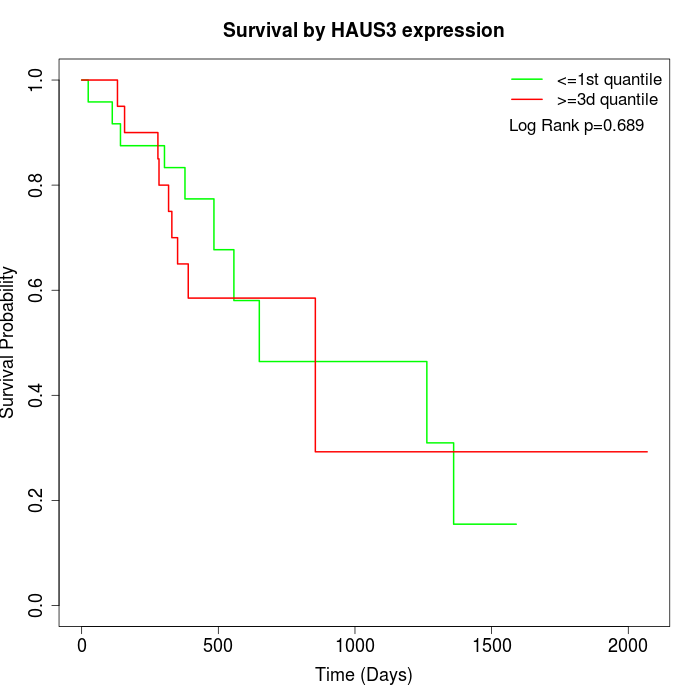 |
| GSE53622 | GSE53624 | TCGA |
Note: Click image to view full size file.
Copy number change of HAUS3:
| Dataset | Gene | EntrezID | Gain | Loss | Normal | Detail |
|---|---|---|---|---|---|---|
| GSE15526 | HAUS3 | 79441 | 0 | 16 | 14 | |
| GSE20123 | HAUS3 | 79441 | 0 | 16 | 14 | |
| GSE43470 | HAUS3 | 79441 | 0 | 17 | 26 | |
| GSE46452 | HAUS3 | 79441 | 1 | 36 | 22 | |
| GSE47630 | HAUS3 | 79441 | 1 | 19 | 20 | |
| GSE54993 | HAUS3 | 79441 | 11 | 0 | 59 | |
| GSE54994 | HAUS3 | 79441 | 3 | 12 | 38 | |
| GSE60625 | HAUS3 | 79441 | 0 | 0 | 11 | |
| GSE74703 | HAUS3 | 79441 | 0 | 13 | 23 | |
| GSE74704 | HAUS3 | 79441 | 0 | 8 | 12 | |
| TCGA | HAUS3 | 79441 | 9 | 47 | 40 |
Total number of gains: 25; Total number of losses: 184; Total Number of normals: 279.
Somatic mutations of HAUS3:
Generating mutation plots.
Highly correlated genes for HAUS3:
Showing top 20/130 corelated genes with mean PCC>0.5.
| Gene1 | Gene2 | Mean PCC | Num. Datasets | Num. PCC<0 | Num. PCC>0.5 |
|---|---|---|---|---|---|
| HAUS3 | SLC22A5 | 0.70202 | 4 | 0 | 4 |
| HAUS3 | CEBPZ | 0.698051 | 4 | 0 | 3 |
| HAUS3 | NUFIP1 | 0.683493 | 3 | 0 | 3 |
| HAUS3 | GTPBP8 | 0.650979 | 3 | 0 | 3 |
| HAUS3 | CCDC150 | 0.641088 | 3 | 0 | 3 |
| HAUS3 | MZT1 | 0.628447 | 4 | 0 | 4 |
| HAUS3 | KMT2A | 0.627127 | 3 | 0 | 3 |
| HAUS3 | ZNF623 | 0.625747 | 4 | 0 | 3 |
| HAUS3 | HMMR-AS1 | 0.618374 | 3 | 0 | 3 |
| HAUS3 | TSNAX | 0.613928 | 4 | 0 | 4 |
| HAUS3 | STIM2 | 0.610621 | 5 | 0 | 5 |
| HAUS3 | SETD6 | 0.61043 | 4 | 0 | 4 |
| HAUS3 | PIGG | 0.608829 | 9 | 0 | 7 |
| HAUS3 | SPTSSA | 0.606865 | 4 | 0 | 3 |
| HAUS3 | ORMDL1 | 0.606509 | 3 | 0 | 3 |
| HAUS3 | EIF5B | 0.605774 | 3 | 0 | 3 |
| HAUS3 | SYNJ1 | 0.602353 | 4 | 0 | 4 |
| HAUS3 | YY1 | 0.601915 | 4 | 0 | 3 |
| HAUS3 | PRPF40A | 0.600728 | 5 | 0 | 3 |
| HAUS3 | MCTP2 | 0.59948 | 5 | 0 | 4 |
For details and further investigation, click here