| Full name: hematopoietic cell-specific Lyn substrate 1 | Alias Symbol: HS1|CTTNL | ||
| Type: protein-coding gene | Cytoband: 3q13.33 | ||
| Entrez ID: 3059 | HGNC ID: HGNC:4844 | Ensembl Gene: ENSG00000180353 | OMIM ID: 601306 |
HCLS1 involved pathways:
| KEGG pathway | Description | View |
|---|---|---|
| hsa04530 | Tight junction | |
| hsa05100 | Bacterial invasion of epithelial cells | |
| hsa05205 | Proteoglycans in cancer |
Expression of HCLS1:
| Dataset | Gene | EntrezID | Probe | Log2FC | Adj.pValue | Expression |
|---|---|---|---|---|---|---|
| GSE17351 | HCLS1 | 3059 | 202957_at | 0.4344 | 0.7768 | |
| GSE20347 | HCLS1 | 3059 | 202957_at | -0.0277 | 0.9336 | |
| GSE23400 | HCLS1 | 3059 | 202957_at | 0.3245 | 0.0327 | |
| GSE26886 | HCLS1 | 3059 | 202957_at | -0.3721 | 0.5337 | |
| GSE29001 | HCLS1 | 3059 | 202957_at | 0.2164 | 0.5790 | |
| GSE38129 | HCLS1 | 3059 | 202957_at | 0.1106 | 0.7706 | |
| GSE45670 | HCLS1 | 3059 | 202957_at | -0.2432 | 0.5284 | |
| GSE53622 | HCLS1 | 3059 | 116554 | -0.0264 | 0.8463 | |
| GSE53624 | HCLS1 | 3059 | 116554 | -0.1731 | 0.2857 | |
| GSE63941 | HCLS1 | 3059 | 202957_at | 1.7989 | 0.4026 | |
| GSE77861 | HCLS1 | 3059 | 202957_at | 0.6219 | 0.2355 | |
| GSE97050 | HCLS1 | 3059 | A_23_P73429 | 0.7564 | 0.1726 | |
| SRP007169 | HCLS1 | 3059 | RNAseq | 2.7239 | 0.0026 | |
| SRP064894 | HCLS1 | 3059 | RNAseq | 0.8826 | 0.0032 | |
| SRP133303 | HCLS1 | 3059 | RNAseq | 0.2169 | 0.2458 | |
| SRP159526 | HCLS1 | 3059 | RNAseq | -0.2369 | 0.7432 | |
| SRP193095 | HCLS1 | 3059 | RNAseq | 0.5184 | 0.0438 | |
| SRP219564 | HCLS1 | 3059 | RNAseq | 0.8774 | 0.0646 | |
| TCGA | HCLS1 | 3059 | RNAseq | 0.0775 | 0.5465 |
Upregulated datasets: 1; Downregulated datasets: 0.
Survival by HCLS1 expression:
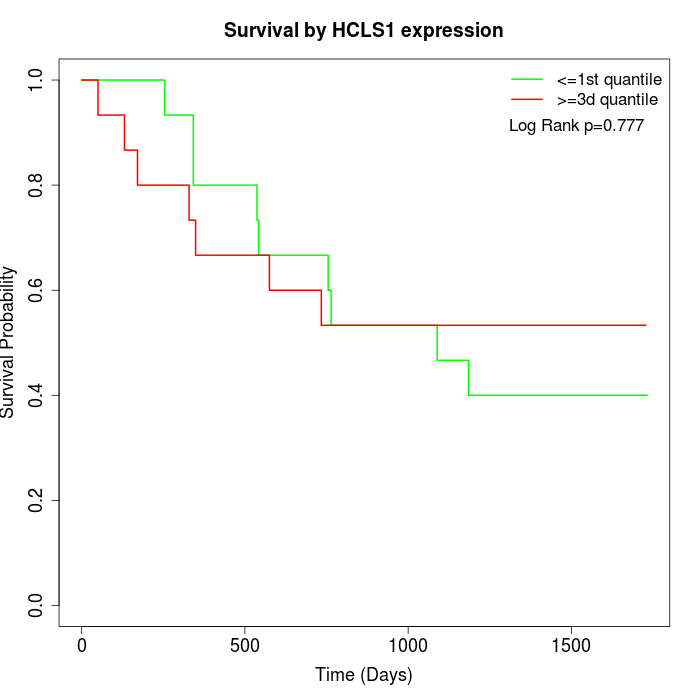 | 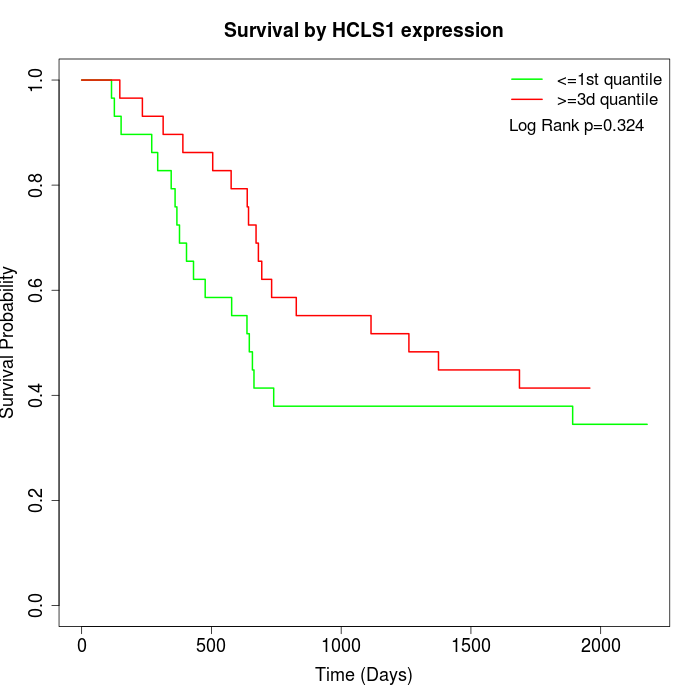 | 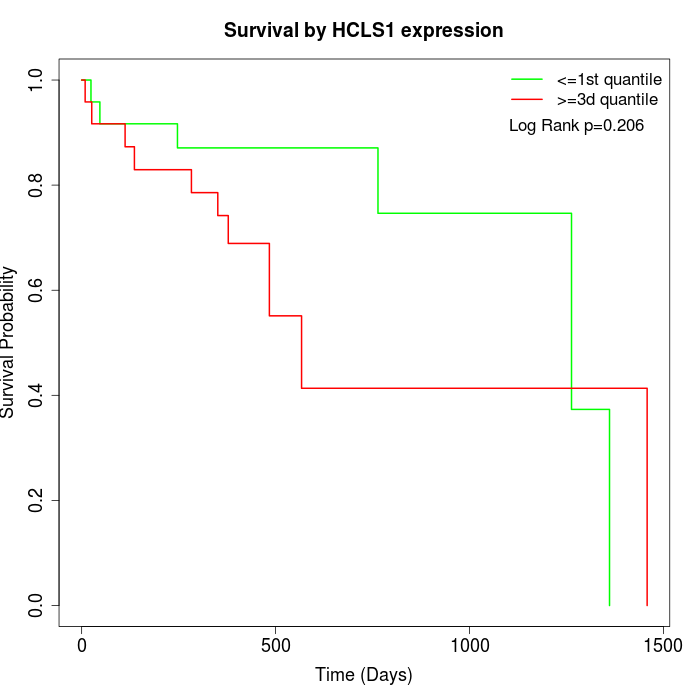 |
| GSE53622 | GSE53624 | TCGA |
Note: Click image to view full size file.
Copy number change of HCLS1:
| Dataset | Gene | EntrezID | Gain | Loss | Normal | Detail |
|---|---|---|---|---|---|---|
| GSE15526 | HCLS1 | 3059 | 18 | 0 | 12 | |
| GSE20123 | HCLS1 | 3059 | 18 | 0 | 12 | |
| GSE43470 | HCLS1 | 3059 | 20 | 0 | 23 | |
| GSE46452 | HCLS1 | 3059 | 14 | 5 | 40 | |
| GSE47630 | HCLS1 | 3059 | 16 | 5 | 19 | |
| GSE54993 | HCLS1 | 3059 | 2 | 6 | 62 | |
| GSE54994 | HCLS1 | 3059 | 30 | 4 | 19 | |
| GSE60625 | HCLS1 | 3059 | 0 | 6 | 5 | |
| GSE74703 | HCLS1 | 3059 | 16 | 0 | 20 | |
| GSE74704 | HCLS1 | 3059 | 13 | 0 | 7 | |
| TCGA | HCLS1 | 3059 | 54 | 6 | 36 |
Total number of gains: 201; Total number of losses: 32; Total Number of normals: 255.
Somatic mutations of HCLS1:
Generating mutation plots.
Highly correlated genes for HCLS1:
Showing top 20/412 corelated genes with mean PCC>0.5.
| Gene1 | Gene2 | Mean PCC | Num. Datasets | Num. PCC<0 | Num. PCC>0.5 |
|---|---|---|---|---|---|
| HCLS1 | C19orf38 | 0.775225 | 3 | 0 | 3 |
| HCLS1 | C1orf162 | 0.772494 | 6 | 0 | 5 |
| HCLS1 | CORO1A | 0.750492 | 11 | 0 | 11 |
| HCLS1 | TFIP11 | 0.745725 | 3 | 0 | 3 |
| HCLS1 | CD37 | 0.740574 | 8 | 0 | 7 |
| HCLS1 | EFTUD2 | 0.739134 | 3 | 0 | 3 |
| HCLS1 | SNX20 | 0.732725 | 6 | 0 | 4 |
| HCLS1 | CLEC12A | 0.731069 | 4 | 0 | 4 |
| HCLS1 | NEDD9 | 0.729477 | 3 | 0 | 3 |
| HCLS1 | CD53 | 0.728448 | 9 | 0 | 8 |
| HCLS1 | IRF8 | 0.726672 | 11 | 0 | 11 |
| HCLS1 | EVI2B | 0.726056 | 11 | 0 | 9 |
| HCLS1 | TNFSF8 | 0.725679 | 5 | 0 | 4 |
| HCLS1 | BTN2A2 | 0.725291 | 3 | 0 | 3 |
| HCLS1 | ARHGAP9 | 0.724892 | 7 | 0 | 7 |
| HCLS1 | PARVG | 0.718681 | 6 | 0 | 5 |
| HCLS1 | DOCK2 | 0.715771 | 10 | 0 | 9 |
| HCLS1 | CERKL | 0.715487 | 3 | 0 | 3 |
| HCLS1 | GPR132 | 0.708427 | 4 | 0 | 4 |
| HCLS1 | PRR13 | 0.706722 | 4 | 0 | 4 |
For details and further investigation, click here