| Full name: hdc homolog, cell cycle regulator | Alias Symbol: HDCL|hHDC|HDC|dJ225E12.1 | ||
| Type: protein-coding gene | Cytoband: 6q24.1 | ||
| Entrez ID: 51696 | HGNC ID: HGNC:21041 | Ensembl Gene: ENSG00000112406 | OMIM ID: 607977 |
Expression of HECA:
| Dataset | Gene | EntrezID | Probe | Log2FC | Adj.pValue | Expression |
|---|---|---|---|---|---|---|
| GSE17351 | HECA | 51696 | 218603_at | -0.2230 | 0.3611 | |
| GSE20347 | HECA | 51696 | 218603_at | -0.6081 | 0.0000 | |
| GSE23400 | HECA | 51696 | 218603_at | -0.3409 | 0.0002 | |
| GSE26886 | HECA | 51696 | 218603_at | -0.3546 | 0.1478 | |
| GSE29001 | HECA | 51696 | 218603_at | -0.3657 | 0.0592 | |
| GSE38129 | HECA | 51696 | 218603_at | -0.4470 | 0.0018 | |
| GSE45670 | HECA | 51696 | 218603_at | -0.3091 | 0.0240 | |
| GSE53622 | HECA | 51696 | 51201 | -0.7060 | 0.0000 | |
| GSE53624 | HECA | 51696 | 51201 | -0.7428 | 0.0000 | |
| GSE63941 | HECA | 51696 | 218603_at | -0.1245 | 0.8338 | |
| GSE77861 | HECA | 51696 | 218603_at | -0.3073 | 0.3450 | |
| GSE97050 | HECA | 51696 | A_23_P59349 | -0.6156 | 0.0897 | |
| SRP007169 | HECA | 51696 | RNAseq | -1.7667 | 0.0000 | |
| SRP008496 | HECA | 51696 | RNAseq | -1.4224 | 0.0000 | |
| SRP064894 | HECA | 51696 | RNAseq | -0.6330 | 0.0003 | |
| SRP133303 | HECA | 51696 | RNAseq | -0.3984 | 0.0059 | |
| SRP159526 | HECA | 51696 | RNAseq | -0.7796 | 0.0214 | |
| SRP193095 | HECA | 51696 | RNAseq | -0.9244 | 0.0000 | |
| SRP219564 | HECA | 51696 | RNAseq | -0.7185 | 0.0525 | |
| TCGA | HECA | 51696 | RNAseq | 0.0169 | 0.7152 |
Upregulated datasets: 0; Downregulated datasets: 2.
Survival by HECA expression:
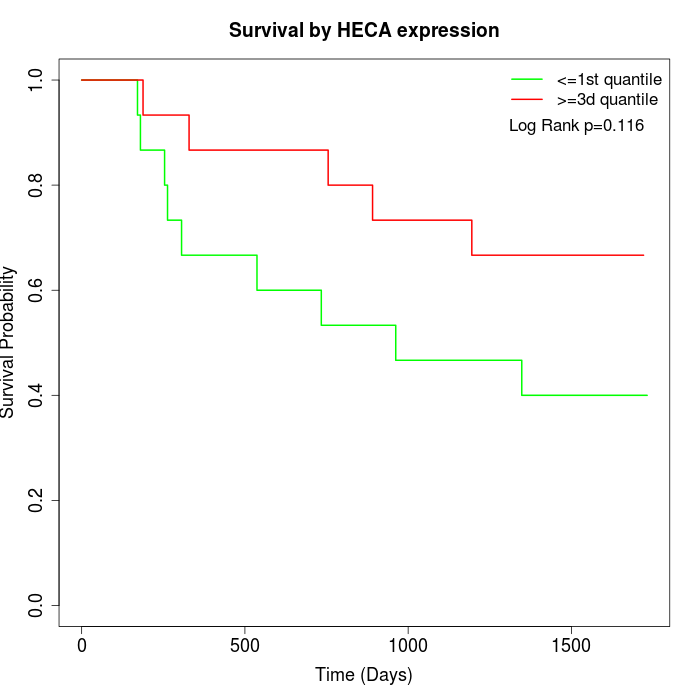 | 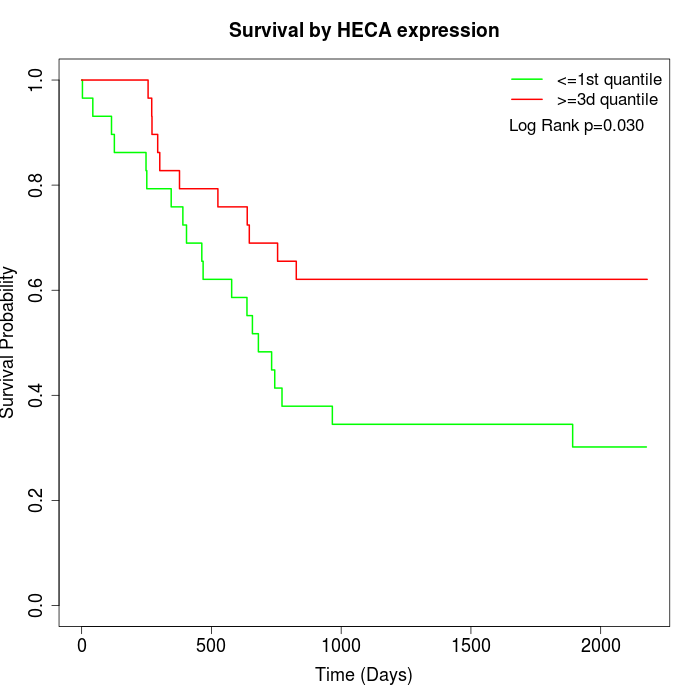 | 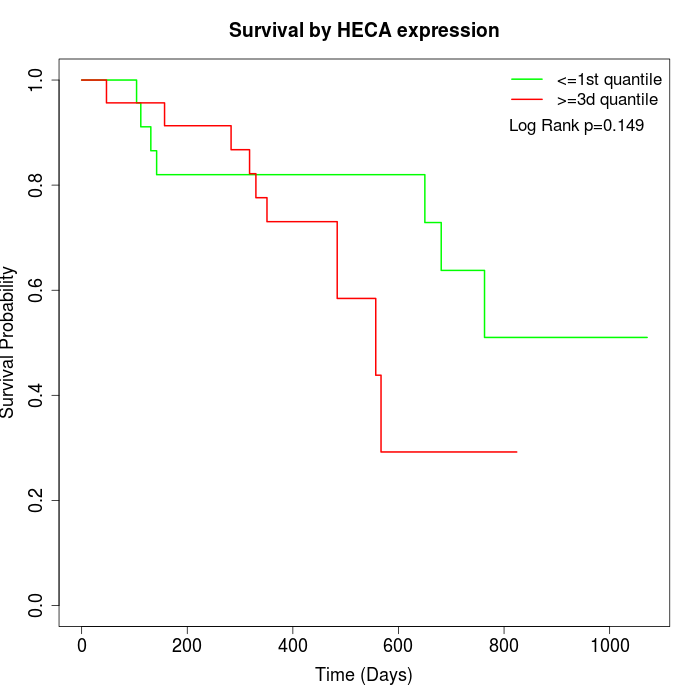 |
| GSE53622 | GSE53624 | TCGA |
Note: Click image to view full size file.
Copy number change of HECA:
| Dataset | Gene | EntrezID | Gain | Loss | Normal | Detail |
|---|---|---|---|---|---|---|
| GSE15526 | HECA | 51696 | 2 | 4 | 24 | |
| GSE20123 | HECA | 51696 | 2 | 3 | 25 | |
| GSE43470 | HECA | 51696 | 5 | 0 | 38 | |
| GSE46452 | HECA | 51696 | 3 | 10 | 46 | |
| GSE47630 | HECA | 51696 | 9 | 4 | 27 | |
| GSE54993 | HECA | 51696 | 3 | 2 | 65 | |
| GSE54994 | HECA | 51696 | 8 | 8 | 37 | |
| GSE60625 | HECA | 51696 | 0 | 1 | 10 | |
| GSE74703 | HECA | 51696 | 4 | 0 | 32 | |
| GSE74704 | HECA | 51696 | 0 | 1 | 19 | |
| TCGA | HECA | 51696 | 11 | 18 | 67 |
Total number of gains: 47; Total number of losses: 51; Total Number of normals: 390.
Somatic mutations of HECA:
Generating mutation plots.
Highly correlated genes for HECA:
Showing top 20/1419 corelated genes with mean PCC>0.5.
| Gene1 | Gene2 | Mean PCC | Num. Datasets | Num. PCC<0 | Num. PCC>0.5 |
|---|---|---|---|---|---|
| HECA | RSPH3 | 0.777706 | 4 | 0 | 4 |
| HECA | ZFP62 | 0.774686 | 4 | 0 | 3 |
| HECA | CA13 | 0.735284 | 3 | 0 | 3 |
| HECA | ZRANB1 | 0.712712 | 4 | 0 | 3 |
| HECA | NDUFS3 | 0.712479 | 3 | 0 | 3 |
| HECA | AKAP17A | 0.707062 | 3 | 0 | 3 |
| HECA | SLCO2A1 | 0.706261 | 3 | 0 | 3 |
| HECA | CASC3 | 0.705495 | 3 | 0 | 3 |
| HECA | ANKRD13A | 0.705351 | 6 | 0 | 6 |
| HECA | ZYG11B | 0.704782 | 4 | 0 | 4 |
| HECA | DLD | 0.702308 | 3 | 0 | 3 |
| HECA | FAM214A | 0.701669 | 6 | 0 | 6 |
| HECA | BLNK | 0.698215 | 10 | 0 | 10 |
| HECA | EPG5 | 0.695238 | 5 | 0 | 5 |
| HECA | HDHD2 | 0.692969 | 5 | 0 | 5 |
| HECA | SLC10A5 | 0.69173 | 3 | 0 | 3 |
| HECA | RAB11B-AS1 | 0.690942 | 3 | 0 | 3 |
| HECA | COPS2 | 0.689908 | 4 | 0 | 4 |
| HECA | DDI2 | 0.689634 | 3 | 0 | 3 |
| HECA | ETFA | 0.687473 | 3 | 0 | 3 |
For details and further investigation, click here