| Full name: integrin subunit alpha E | Alias Symbol: CD103|HUMINAE | ||
| Type: protein-coding gene | Cytoband: 17p13.2 | ||
| Entrez ID: 3682 | HGNC ID: HGNC:6147 | Ensembl Gene: ENSG00000083457 | OMIM ID: 604682 |
ITGAE involved pathways:
| KEGG pathway | Description | View |
|---|---|---|
| hsa04810 | Regulation of actin cytoskeleton |
Expression of ITGAE:
| Dataset | Gene | EntrezID | Probe | Log2FC | Adj.pValue | Expression |
|---|---|---|---|---|---|---|
| GSE17351 | ITGAE | 3682 | 205055_at | 0.3182 | 0.2697 | |
| GSE20347 | ITGAE | 3682 | 205055_at | 0.2201 | 0.2724 | |
| GSE23400 | ITGAE | 3682 | 205055_at | 0.4258 | 0.0000 | |
| GSE26886 | ITGAE | 3682 | 205055_at | 0.3213 | 0.1157 | |
| GSE29001 | ITGAE | 3682 | 205055_at | 0.3532 | 0.0769 | |
| GSE38129 | ITGAE | 3682 | 205055_at | 0.3403 | 0.0303 | |
| GSE45670 | ITGAE | 3682 | 205055_at | 0.2313 | 0.1484 | |
| GSE53622 | ITGAE | 3682 | 51762 | -0.1150 | 0.1449 | |
| GSE53624 | ITGAE | 3682 | 51762 | 0.0880 | 0.1503 | |
| GSE63941 | ITGAE | 3682 | 205055_at | -0.6427 | 0.1045 | |
| GSE77861 | ITGAE | 3682 | 205055_at | -0.0122 | 0.9661 | |
| GSE97050 | ITGAE | 3682 | A_23_P218375 | 0.1812 | 0.4978 | |
| SRP007169 | ITGAE | 3682 | RNAseq | -0.0966 | 0.8486 | |
| SRP008496 | ITGAE | 3682 | RNAseq | 0.0539 | 0.8470 | |
| SRP064894 | ITGAE | 3682 | RNAseq | 0.2899 | 0.2037 | |
| SRP133303 | ITGAE | 3682 | RNAseq | 0.0384 | 0.8350 | |
| SRP159526 | ITGAE | 3682 | RNAseq | 0.1836 | 0.5469 | |
| SRP193095 | ITGAE | 3682 | RNAseq | -0.3652 | 0.0095 | |
| SRP219564 | ITGAE | 3682 | RNAseq | 0.3904 | 0.2183 | |
| TCGA | ITGAE | 3682 | RNAseq | 0.1231 | 0.0948 |
Upregulated datasets: 0; Downregulated datasets: 0.
Survival by ITGAE expression:
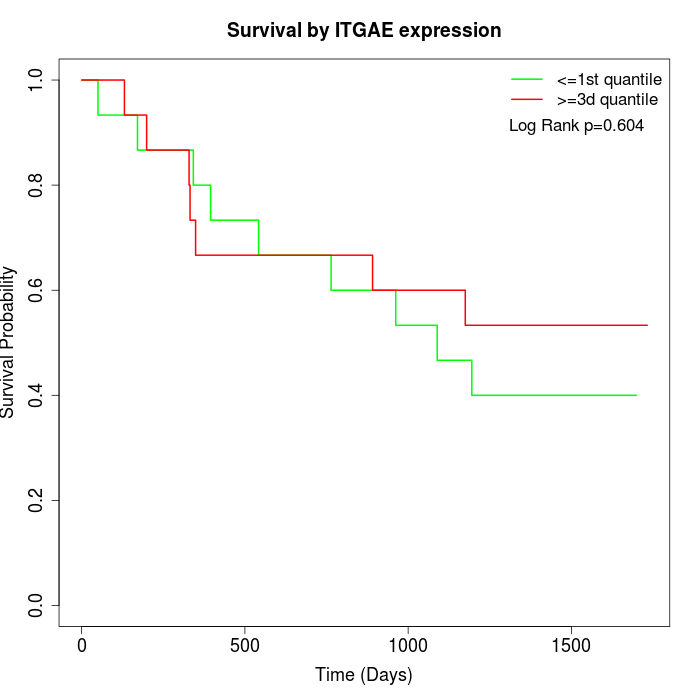 | 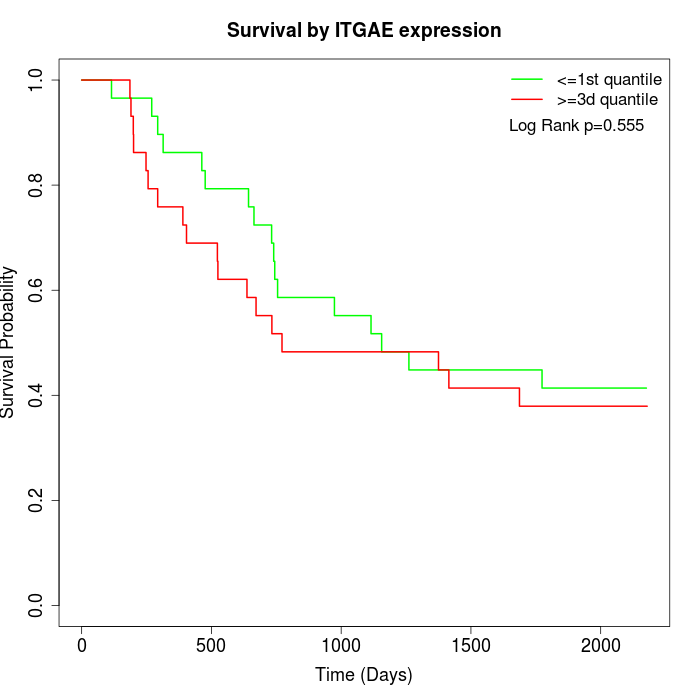 | 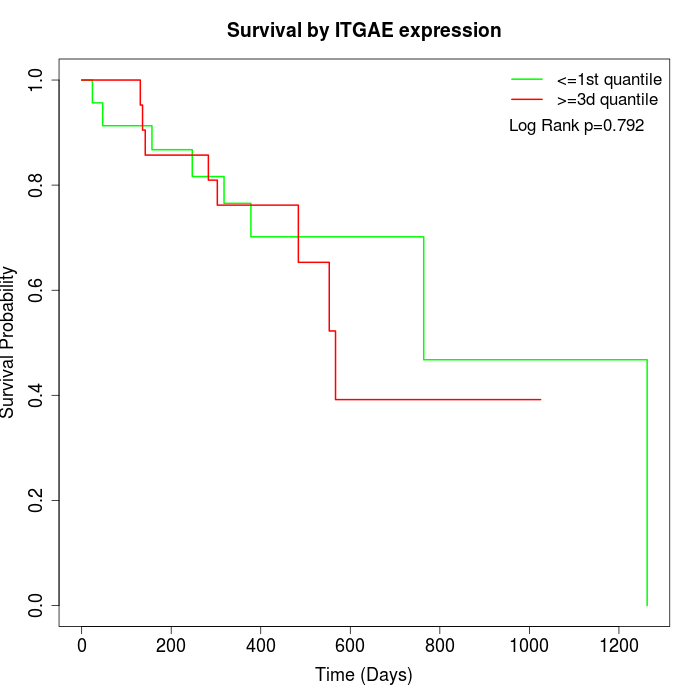 |
| GSE53622 | GSE53624 | TCGA |
Note: Click image to view full size file.
Copy number change of ITGAE:
| Dataset | Gene | EntrezID | Gain | Loss | Normal | Detail |
|---|---|---|---|---|---|---|
| GSE15526 | ITGAE | 3682 | 5 | 3 | 22 | |
| GSE20123 | ITGAE | 3682 | 5 | 4 | 21 | |
| GSE43470 | ITGAE | 3682 | 1 | 6 | 36 | |
| GSE46452 | ITGAE | 3682 | 34 | 1 | 24 | |
| GSE47630 | ITGAE | 3682 | 7 | 1 | 32 | |
| GSE54993 | ITGAE | 3682 | 4 | 3 | 63 | |
| GSE54994 | ITGAE | 3682 | 5 | 9 | 39 | |
| GSE60625 | ITGAE | 3682 | 4 | 0 | 7 | |
| GSE74703 | ITGAE | 3682 | 1 | 3 | 32 | |
| GSE74704 | ITGAE | 3682 | 3 | 2 | 15 | |
| TCGA | ITGAE | 3682 | 18 | 21 | 57 |
Total number of gains: 87; Total number of losses: 53; Total Number of normals: 348.
Somatic mutations of ITGAE:
Generating mutation plots.
Highly correlated genes for ITGAE:
Showing top 20/594 corelated genes with mean PCC>0.5.
| Gene1 | Gene2 | Mean PCC | Num. Datasets | Num. PCC<0 | Num. PCC>0.5 |
|---|---|---|---|---|---|
| ITGAE | TMTC4 | 0.798943 | 3 | 0 | 3 |
| ITGAE | TMED8 | 0.775805 | 3 | 0 | 3 |
| ITGAE | UTP23 | 0.756653 | 3 | 0 | 3 |
| ITGAE | PREX1 | 0.754511 | 3 | 0 | 3 |
| ITGAE | ATP11C | 0.754278 | 3 | 0 | 3 |
| ITGAE | IMMP1L | 0.752029 | 3 | 0 | 3 |
| ITGAE | RICTOR | 0.744245 | 3 | 0 | 3 |
| ITGAE | DENND4B | 0.738437 | 3 | 0 | 3 |
| ITGAE | DHRSX | 0.73751 | 4 | 0 | 4 |
| ITGAE | SLC41A2 | 0.729953 | 3 | 0 | 3 |
| ITGAE | INTS9 | 0.727489 | 3 | 0 | 3 |
| ITGAE | NAPEPLD | 0.721349 | 3 | 0 | 3 |
| ITGAE | BIVM | 0.7207 | 3 | 0 | 3 |
| ITGAE | RGS1 | 0.714542 | 3 | 0 | 3 |
| ITGAE | LRRC41 | 0.713096 | 3 | 0 | 3 |
| ITGAE | PKIG | 0.706697 | 3 | 0 | 3 |
| ITGAE | ARHGAP18 | 0.702631 | 3 | 0 | 3 |
| ITGAE | TEKT3 | 0.693841 | 3 | 0 | 3 |
| ITGAE | TFEC | 0.692759 | 3 | 0 | 3 |
| ITGAE | UCP2 | 0.69266 | 3 | 0 | 3 |
For details and further investigation, click here