| Full name: kelch repeat and BTB domain containing 4 | Alias Symbol: FLJ10450|HSPC252 | ||
| Type: protein-coding gene | Cytoband: 11p11.2 | ||
| Entrez ID: 55709 | HGNC ID: HGNC:23761 | Ensembl Gene: ENSG00000123444 | OMIM ID: 617645 |
Expression of KBTBD4:
| Dataset | Gene | EntrezID | Probe | Log2FC | Adj.pValue | Expression |
|---|---|---|---|---|---|---|
| GSE17351 | KBTBD4 | 55709 | 218569_s_at | -0.3461 | 0.6951 | |
| GSE20347 | KBTBD4 | 55709 | 218569_s_at | -0.0893 | 0.5052 | |
| GSE23400 | KBTBD4 | 55709 | 218569_s_at | -0.0804 | 0.0885 | |
| GSE26886 | KBTBD4 | 55709 | 218569_s_at | -0.0282 | 0.9347 | |
| GSE29001 | KBTBD4 | 55709 | 218569_s_at | 0.0186 | 0.9389 | |
| GSE38129 | KBTBD4 | 55709 | 218569_s_at | -0.0520 | 0.6911 | |
| GSE45670 | KBTBD4 | 55709 | 218569_s_at | -0.2344 | 0.1379 | |
| GSE53622 | KBTBD4 | 55709 | 17079 | -0.0255 | 0.7159 | |
| GSE53624 | KBTBD4 | 55709 | 17079 | -0.0221 | 0.7916 | |
| GSE63941 | KBTBD4 | 55709 | 218569_s_at | -0.2340 | 0.6449 | |
| GSE77861 | KBTBD4 | 55709 | 218569_s_at | -0.0040 | 0.9837 | |
| GSE97050 | KBTBD4 | 55709 | A_33_P3345255 | 0.1884 | 0.4263 | |
| SRP007169 | KBTBD4 | 55709 | RNAseq | -0.6249 | 0.1269 | |
| SRP008496 | KBTBD4 | 55709 | RNAseq | -0.6056 | 0.0141 | |
| SRP064894 | KBTBD4 | 55709 | RNAseq | -0.2126 | 0.1346 | |
| SRP133303 | KBTBD4 | 55709 | RNAseq | -0.2397 | 0.1021 | |
| SRP159526 | KBTBD4 | 55709 | RNAseq | -0.2004 | 0.4645 | |
| SRP193095 | KBTBD4 | 55709 | RNAseq | -0.3572 | 0.0016 | |
| SRP219564 | KBTBD4 | 55709 | RNAseq | -0.3521 | 0.2756 | |
| TCGA | KBTBD4 | 55709 | RNAseq | -0.2244 | 0.0002 |
Upregulated datasets: 0; Downregulated datasets: 0.
Survival by KBTBD4 expression:
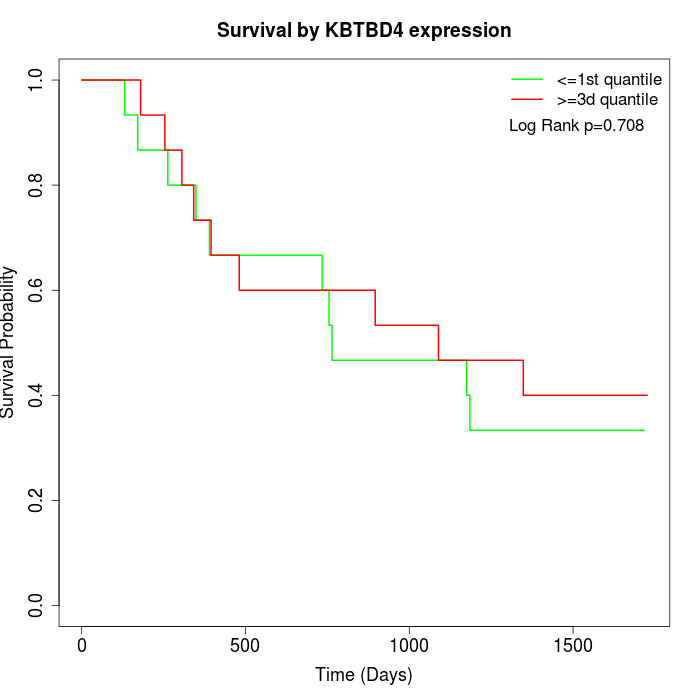 | 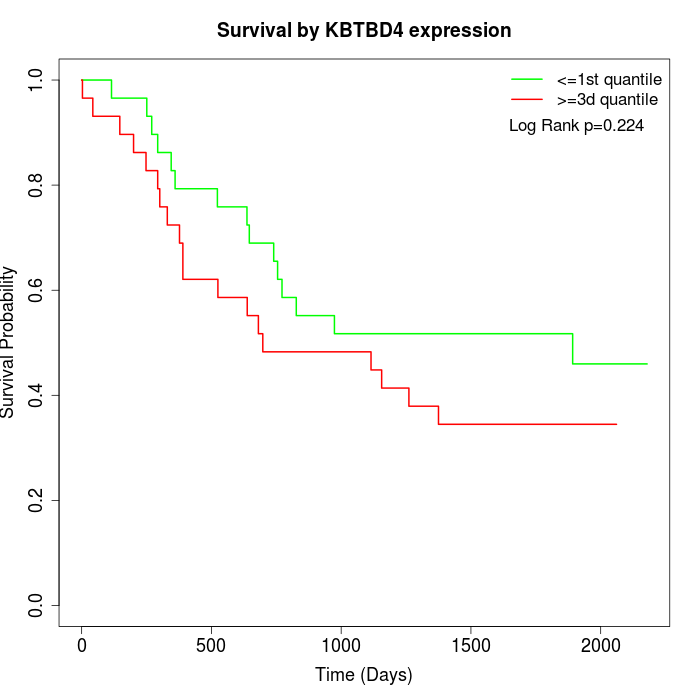 | 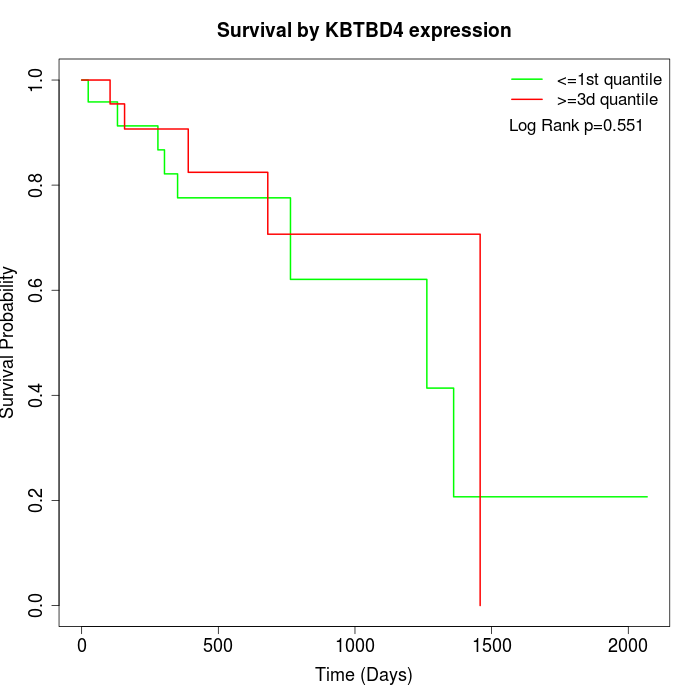 |
| GSE53622 | GSE53624 | TCGA |
Note: Click image to view full size file.
Copy number change of KBTBD4:
| Dataset | Gene | EntrezID | Gain | Loss | Normal | Detail |
|---|---|---|---|---|---|---|
| GSE15526 | KBTBD4 | 55709 | 3 | 7 | 20 | |
| GSE20123 | KBTBD4 | 55709 | 3 | 6 | 21 | |
| GSE43470 | KBTBD4 | 55709 | 1 | 4 | 38 | |
| GSE46452 | KBTBD4 | 55709 | 8 | 5 | 46 | |
| GSE47630 | KBTBD4 | 55709 | 3 | 9 | 28 | |
| GSE54993 | KBTBD4 | 55709 | 3 | 0 | 67 | |
| GSE54994 | KBTBD4 | 55709 | 1 | 11 | 41 | |
| GSE60625 | KBTBD4 | 55709 | 0 | 0 | 11 | |
| GSE74703 | KBTBD4 | 55709 | 1 | 2 | 33 | |
| GSE74704 | KBTBD4 | 55709 | 2 | 4 | 14 | |
| TCGA | KBTBD4 | 55709 | 10 | 20 | 66 |
Total number of gains: 35; Total number of losses: 68; Total Number of normals: 385.
Somatic mutations of KBTBD4:
Generating mutation plots.
Highly correlated genes for KBTBD4:
Showing top 20/342 corelated genes with mean PCC>0.5.
| Gene1 | Gene2 | Mean PCC | Num. Datasets | Num. PCC<0 | Num. PCC>0.5 |
|---|---|---|---|---|---|
| KBTBD4 | UBA52 | 0.786445 | 3 | 0 | 3 |
| KBTBD4 | TMEM185A | 0.775896 | 3 | 0 | 3 |
| KBTBD4 | TOP2B | 0.76543 | 3 | 0 | 3 |
| KBTBD4 | ING4 | 0.76087 | 3 | 0 | 3 |
| KBTBD4 | ABHD14B | 0.755577 | 3 | 0 | 3 |
| KBTBD4 | TSR2 | 0.750562 | 3 | 0 | 3 |
| KBTBD4 | PARG | 0.746863 | 3 | 0 | 3 |
| KBTBD4 | SIRT1 | 0.746141 | 3 | 0 | 3 |
| KBTBD4 | EPS8 | 0.742187 | 3 | 0 | 3 |
| KBTBD4 | TMEM50B | 0.741479 | 3 | 0 | 3 |
| KBTBD4 | DTD1 | 0.738161 | 3 | 0 | 3 |
| KBTBD4 | COMMD10 | 0.730908 | 3 | 0 | 3 |
| KBTBD4 | ZNF260 | 0.723509 | 3 | 0 | 3 |
| KBTBD4 | LRRC41 | 0.720431 | 3 | 0 | 3 |
| KBTBD4 | TFCP2 | 0.716907 | 4 | 0 | 3 |
| KBTBD4 | ATP11C | 0.714279 | 3 | 0 | 3 |
| KBTBD4 | ABHD16A | 0.707767 | 3 | 0 | 3 |
| KBTBD4 | FAM3C | 0.705322 | 4 | 0 | 4 |
| KBTBD4 | P2RY13 | 0.704732 | 3 | 0 | 3 |
| KBTBD4 | S100PBP | 0.701671 | 3 | 0 | 3 |
For details and further investigation, click here