| Full name: S100P binding protein | Alias Symbol: FLJ12903|S100PBPR | ||
| Type: protein-coding gene | Cytoband: 1p35.1 | ||
| Entrez ID: 64766 | HGNC ID: HGNC:25768 | Ensembl Gene: ENSG00000116497 | OMIM ID: 611889 |
Expression of S100PBP:
| Dataset | Gene | EntrezID | Probe | Log2FC | Adj.pValue | Expression |
|---|---|---|---|---|---|---|
| GSE17351 | S100PBP | 64766 | 218370_s_at | 0.1259 | 0.6884 | |
| GSE20347 | S100PBP | 64766 | 218370_s_at | 0.4621 | 0.0072 | |
| GSE23400 | S100PBP | 64766 | 218370_s_at | 0.4174 | 0.0000 | |
| GSE26886 | S100PBP | 64766 | 218370_s_at | 0.4962 | 0.0953 | |
| GSE29001 | S100PBP | 64766 | 218370_s_at | 0.7863 | 0.0036 | |
| GSE38129 | S100PBP | 64766 | 218370_s_at | 0.3417 | 0.0176 | |
| GSE45670 | S100PBP | 64766 | 218370_s_at | -0.0472 | 0.8406 | |
| GSE53622 | S100PBP | 64766 | 24694 | 0.6787 | 0.0000 | |
| GSE53624 | S100PBP | 64766 | 131641 | 0.4264 | 0.0000 | |
| GSE63941 | S100PBP | 64766 | 218370_s_at | -0.6837 | 0.1005 | |
| GSE77861 | S100PBP | 64766 | 222610_s_at | 0.6847 | 0.0082 | |
| GSE97050 | S100PBP | 64766 | A_23_P338952 | -0.0019 | 0.9930 | |
| SRP007169 | S100PBP | 64766 | RNAseq | 1.8770 | 0.0007 | |
| SRP008496 | S100PBP | 64766 | RNAseq | 1.9231 | 0.0000 | |
| SRP064894 | S100PBP | 64766 | RNAseq | 0.7661 | 0.0000 | |
| SRP133303 | S100PBP | 64766 | RNAseq | 0.4307 | 0.0000 | |
| SRP159526 | S100PBP | 64766 | RNAseq | 0.2047 | 0.3097 | |
| SRP193095 | S100PBP | 64766 | RNAseq | 0.4598 | 0.0000 | |
| SRP219564 | S100PBP | 64766 | RNAseq | 0.1442 | 0.5337 | |
| TCGA | S100PBP | 64766 | RNAseq | 0.0416 | 0.4455 |
Upregulated datasets: 2; Downregulated datasets: 0.
Survival by S100PBP expression:
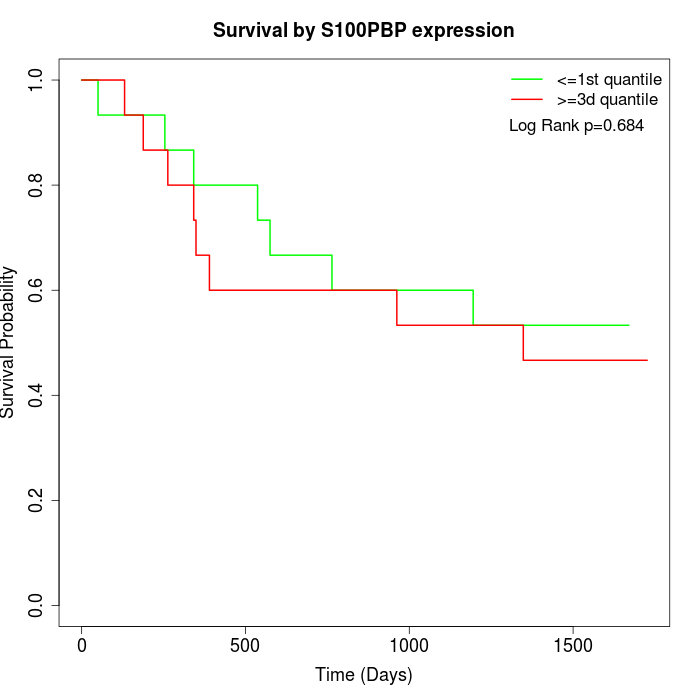 | 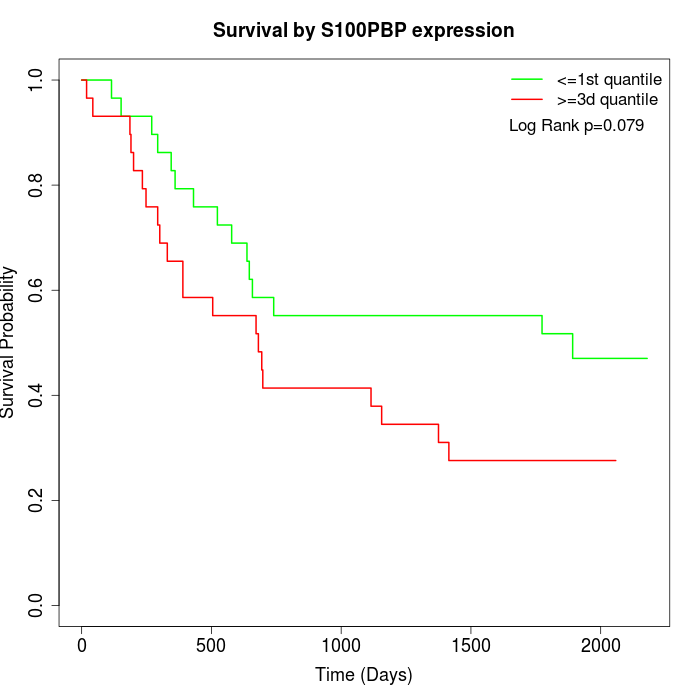 | 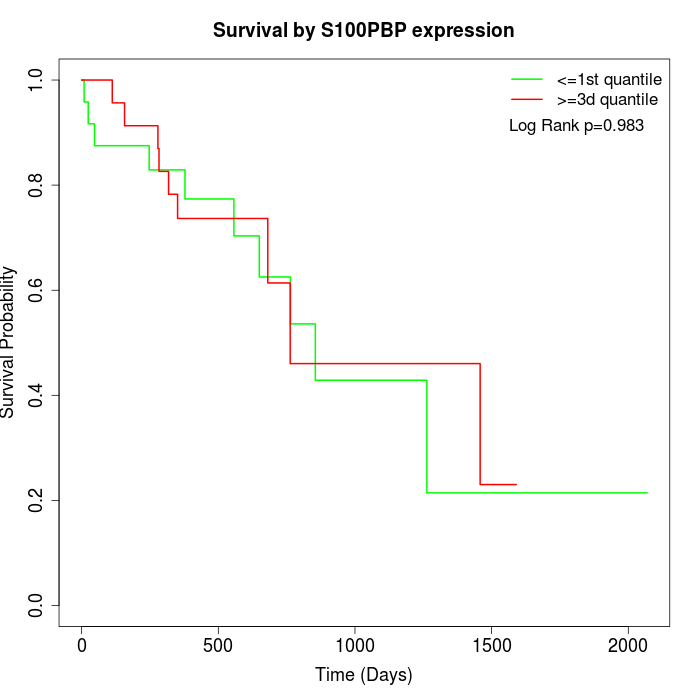 |
| GSE53622 | GSE53624 | TCGA |
Note: Click image to view full size file.
Copy number change of S100PBP:
| Dataset | Gene | EntrezID | Gain | Loss | Normal | Detail |
|---|---|---|---|---|---|---|
| GSE15526 | S100PBP | 64766 | 2 | 5 | 23 | |
| GSE20123 | S100PBP | 64766 | 2 | 4 | 24 | |
| GSE43470 | S100PBP | 64766 | 5 | 6 | 32 | |
| GSE46452 | S100PBP | 64766 | 5 | 1 | 53 | |
| GSE47630 | S100PBP | 64766 | 8 | 3 | 29 | |
| GSE54993 | S100PBP | 64766 | 1 | 1 | 68 | |
| GSE54994 | S100PBP | 64766 | 11 | 2 | 40 | |
| GSE60625 | S100PBP | 64766 | 0 | 0 | 11 | |
| GSE74703 | S100PBP | 64766 | 4 | 3 | 29 | |
| GSE74704 | S100PBP | 64766 | 1 | 0 | 19 | |
| TCGA | S100PBP | 64766 | 12 | 18 | 66 |
Total number of gains: 51; Total number of losses: 43; Total Number of normals: 394.
Somatic mutations of S100PBP:
Generating mutation plots.
Highly correlated genes for S100PBP:
Showing top 20/1302 corelated genes with mean PCC>0.5.
| Gene1 | Gene2 | Mean PCC | Num. Datasets | Num. PCC<0 | Num. PCC>0.5 |
|---|---|---|---|---|---|
| S100PBP | ANAPC4 | 0.849808 | 3 | 0 | 3 |
| S100PBP | ZNF121 | 0.776161 | 3 | 0 | 3 |
| S100PBP | RAB34 | 0.754419 | 3 | 0 | 3 |
| S100PBP | UBE4A | 0.749467 | 3 | 0 | 3 |
| S100PBP | NF1 | 0.748038 | 3 | 0 | 3 |
| S100PBP | ZNF518B | 0.735593 | 5 | 0 | 5 |
| S100PBP | GDI1 | 0.735485 | 3 | 0 | 3 |
| S100PBP | WDR54 | 0.734986 | 5 | 0 | 5 |
| S100PBP | FAF2 | 0.729087 | 3 | 0 | 3 |
| S100PBP | PET117 | 0.726858 | 3 | 0 | 3 |
| S100PBP | ATG4C | 0.722128 | 4 | 0 | 4 |
| S100PBP | USF1 | 0.719393 | 3 | 0 | 3 |
| S100PBP | GTF3C2 | 0.714391 | 3 | 0 | 3 |
| S100PBP | PRDM15 | 0.712624 | 3 | 0 | 3 |
| S100PBP | PSMG3 | 0.71229 | 4 | 0 | 4 |
| S100PBP | POC5 | 0.71192 | 5 | 0 | 5 |
| S100PBP | IRF2BPL | 0.70992 | 4 | 0 | 3 |
| S100PBP | USP42 | 0.709268 | 3 | 0 | 3 |
| S100PBP | LRRC58 | 0.706614 | 3 | 0 | 3 |
| S100PBP | RBL2 | 0.705223 | 3 | 0 | 3 |
For details and further investigation, click here